Hyperlinked table of contents that looks like a filing system
This looks like it might be useful to display information about filing systems, with a clickable toc that looks like a filing system!
Source:
This is an Open Notebook with Selected Content - Delayed. All content is licenced with CC-BY. Find out more Here.

This looks like it might be useful to display information about filing systems, with a clickable toc that looks like a filing system!
Source:
Posted in disentangle
26 Nov 2015
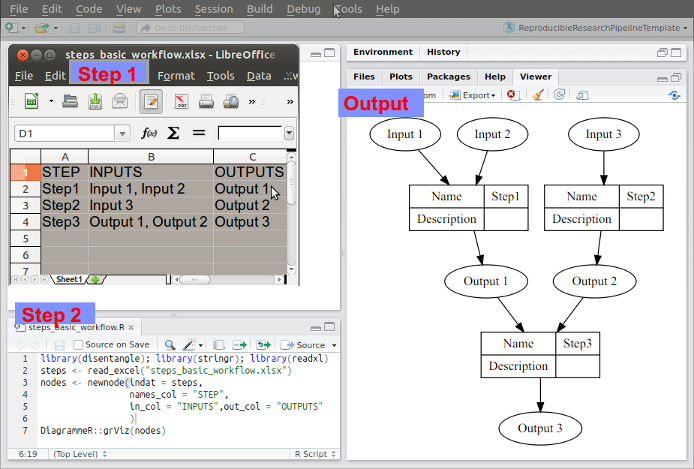
The scientific workflow concept is essentially a pipeline. The method step is the key atomic unit of a scientific pipeline. It consists of inputs, outputs and a rationale for why the step is taken.
A simple way to keep track of the steps, inputs and outputs is shown in Table below:
CLUSTER ,  STEP       , INPUTS                   , OUTPUTS
A  ,       Step1      , "Input 1, Input 2"       , Output 1
A  ,       Step2      ,  Input 3                 , Output 2
B  ,       Step3      , "Output 1, Output 2"     , Output 3
The steps and data listed in this way can be visualised. To achieve this an R function was written as part of my PhD project and is distributed in the R package available on Github https://github.com/ivanhanigan/disentangle.
This is the newnode function. The function returns a string of text
written in the dot language which can be rendered in R using the
DiagrammeR package, or the standalone graphviz package. This creates the graph of this pipeline shown in Figure below. Note that a new field was added for Descriptions as these are highly recommended.
Posted in disentangle
17 Nov 2015
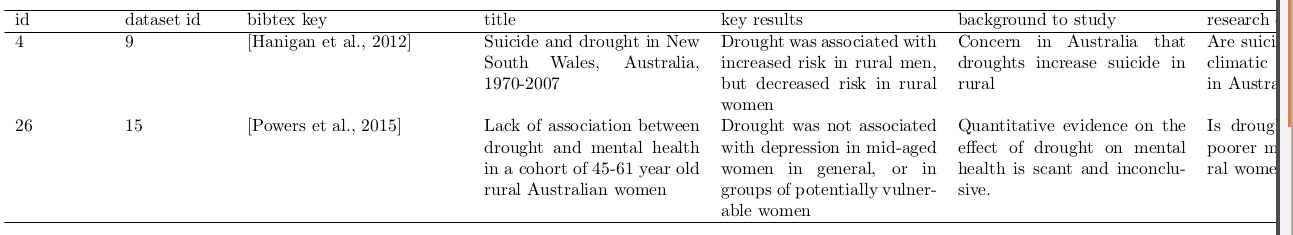
As I compile my papers for the thesis I am keeping notes for my presentation to discuss the results and scope of each study. The work on the ‘evidence tables’ I described in the last two posts has proved useful here. I allowed my self a breif distraction to dig out some code I had developed for a database of case studies demonstrating eco-social tipping points from historical evidence, and show here how to include bibtex info. The bibtex key (from Mendeley in my case) is added to the database, and then the following code:
library(xtable)
library(rpostgrestools) # my own work
if(!exists("ch")) ch <- connect2postgres2("data_inventory_hanigan_dev4")

dat <- dbGetQuery(ch,
"SELECT id, dataset_id, bibtex_key, title,  key_results,background_to_study,
       research_question, study_extent, outcomes, exposures,  covariates, method_protocol,
        general_comments
  FROM publication
  where key_results is not null and key_results != '';
")
names(dat) <- gsub("_", " ", names(dat))
tabcode <- xtable(dat[,1:8])
align(tabcode) <-  c( 'l', 'p{.7in}','p{.8in}','p{1.7in}', 'p{1.7in}', 'p{1.7in}','p{1.8in}','p{1.7in}', 'p{1.7in}')
print(tabcode,  include.rownames = F, table.placement = '!ht',
      floating.environment='sidewaystable',
      sanitize.text.function = function(x) x)
Produces the below table:
Posted in disentangle
15 Nov 2015
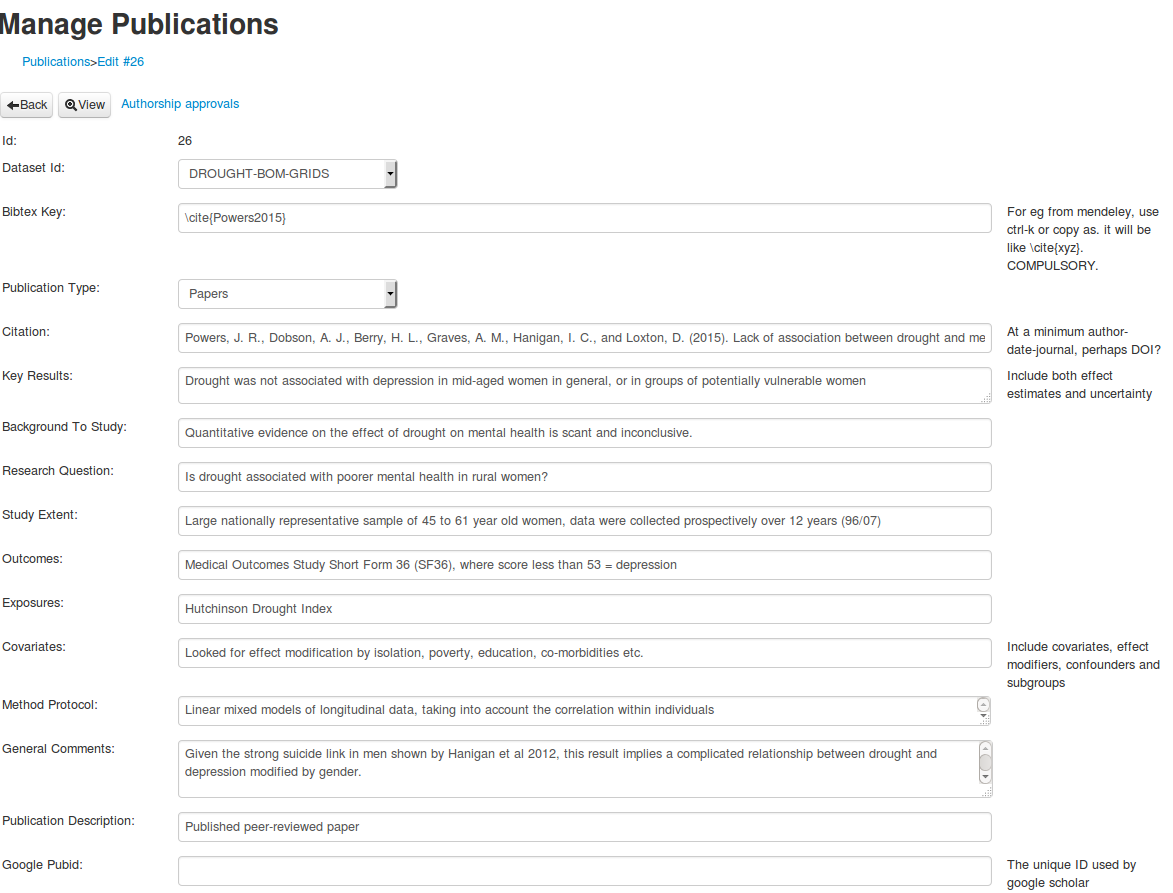
My work yesterday on implementing a lit review section of my data inventory database went pretty well, and I tested this while collating information on the papers I compile into my thesis.
However, as I worked through the information for each paper I realised that attaching this stuff at the EML/dataset level is not always going to work. In particular I have projects in which several papers are part of the one dataset. To deal with this I have invented a non-EML relationship module for publications. So in my new schema the following is possible
eml/project/
           /dataset1/
                    /publication1
                    /publication2
           /dataset2/
                    /etc
In this scenario a single dataset (ie bushfire smoke, temperature and mortality) can be used to write one paper focused on smoke, controlling for temperature. Another paper on heatwaves, controlling for smoke. Indeed we might use time-series Poisson models for one and case-crossover design for the other (this is similar to what I did with Johnston and Morgan).
So the simple thing to do is input these ‘evidence tables’ fields at the publication level, rather than the dataset as I did yesterday.
This also partially solves my problem about aggregating these non-EML tags inside the text of the abstract, and worrying about parsing that to extract the elements of information.
| data_inventory_field | description |
|---|---|
| Citation | At a minimum author-date-journal, perhaps DOI? |
| Key results | Include both effect estimates and uncertainty |
| Background to the study | |
| Research question | |
| Study extent | |
| Outcomes | |
| Exposures | |
| Covariates | Include covariates, effect modifiers, confounders and subgroups |
| Method protocol | |
| General Comments |
Posted in disentangle
14 Nov 2015
I recently read through a lecture slide deck called ‘Judging the Evidence’ by Adrian Sleigh for a course PUBH7001 Introduction to Epidemiology, April 30, 2001.
It had a lot of great material in it but I especially liked the section ‘CRITIQUE OF AN EPIDEMIOLOGIC STUDY’ and slide 11 ‘Quantity of data, duplication’ which says:
Set clear criteria for admission of studies to your ‘judgement of evidence’
Devise ways to tabulate the information
‘Evidence tables’ show key features of design
  (source, sample and study pop, N)
  exposures-outcomes measured
  observation methods
  confounding
  key results
I thought this was a great idea, to build a database for keeping ‘evidence tables’ for each study I read.
I then read through all the slides. There is a lot of great information here, but it was spread out across the narrative. I realised I wanted to collate these into a ‘evidence table’. I also compared this with my understanding of the Ecological Metadata Language (EML) schema and the ‘ANU Data Analysis Plan Template’ and have put together a bit of a ‘cross-walk’ that lets me combine all this info and create a evidence table (database).
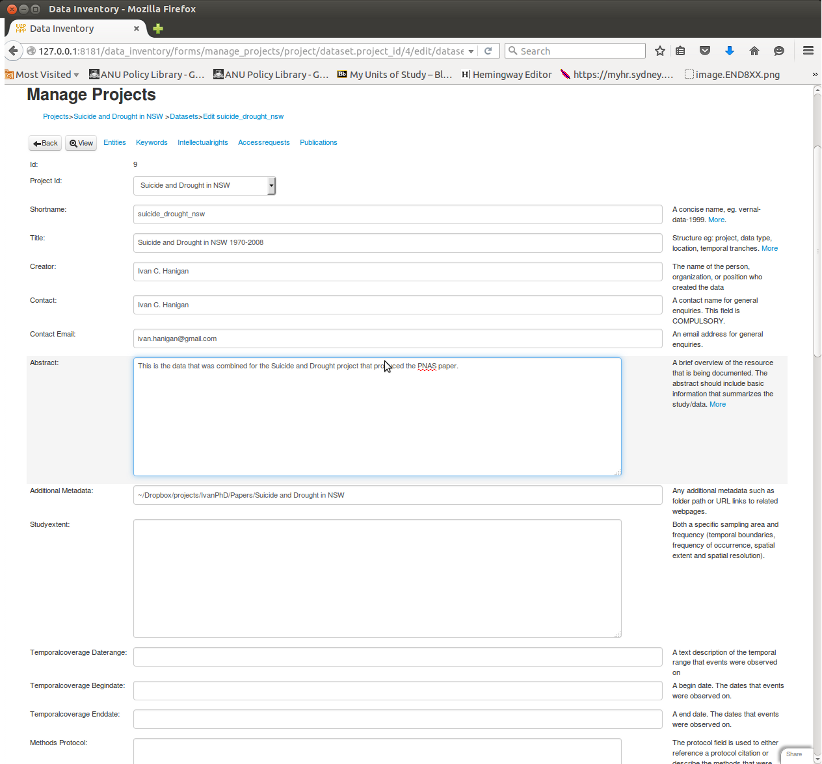
I have started to use the database I built which uses EML concepts heavily and I include some these other ideas into my free data_inventory application for a web2py database https://github.com/ivanhanigan/data_inventory.
It is a webform style data entry interface, and I think good for these ‘evidence tables’. In the first instance I piggy back a lot of the elements into single EML tags, especially the abstract. This may make it hard to parse. The simple solution is to try to keep each element on a seperate line of the absract.
| EML | ANU | Adrian_Sleigh |
|---|---|---|
| dataset/title | Study name | |
| dataset/creator | Person conducting analysis | |
| project/personnel/[data_owner or orginator] | Chief investigator | |
| dataset/abstract | Background to the study | Purpose of Study |
| Study research question | ||
| Specific hypothesis under study | ||
| outcomes of interest/ Exposure variables /Covariates | exposures-outcomes measured | |
| key results | ||
| dataset/studyextent | Study population | Study Setting |
| source / sample and study pop | ||
| dataset/temporalcoverage | Duration of study | |
| dataset/methods_protocol | Study Type | Type of study |
| dataset/sampling_desc | Subject Selection | |
| dataset/methods_steps | analytical strategy | Statistical procedures |
| exposures/ potential confounders or effect modifiers | Confounding | |
| entity/numberOfRecords | Number study subjects | N |
| dataset/distribution_methods | dissemination strategy |
Posted in disentangle
13 Nov 2015


