Newnode: An R function for visualising workflows
The scientific workflow concept is essentially a pipeline. The method step is the key atomic unit of a scientific pipeline. It consists of inputs, outputs and a rationale for why the step is taken.
A simple way to keep track of the steps, inputs and outputs is shown in Table below:
CLUSTER ,  STEP       , INPUTS                   , OUTPUTS
A  ,       Step1      , "Input 1, Input 2"       , Output 1
A  ,       Step2      ,  Input 3                 , Output 2
B  ,       Step3      , "Output 1, Output 2"     , Output 3
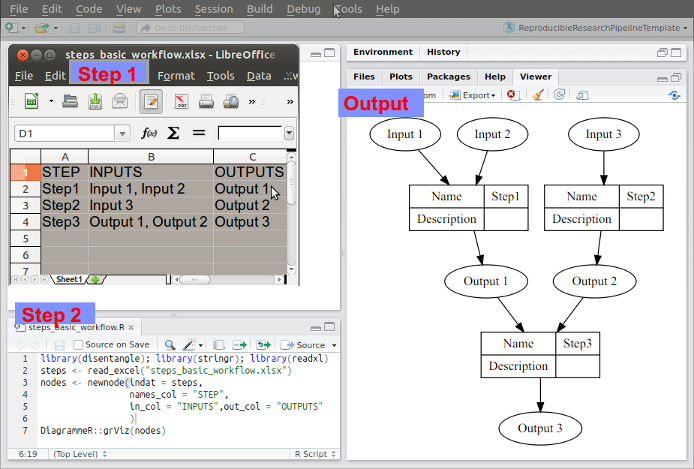
The steps and data listed in this way can be visualised. To achieve this an R function was written as part of my PhD project and is distributed in the R package available on Github https://github.com/ivanhanigan/disentangle.
This is the newnode function. The function returns a string of text
written in the dot language which can be rendered in R using the
DiagrammeR package, or the standalone graphviz package. This creates the graph of this pipeline shown in Figure below. Note that a new field was added for Descriptions as these are highly recommended.