Adequately documenting the methods and results of data analysis helps safeguard against errors of execution and interpretation. It is proposed that reproducible research pipelines address the problem of adequate documentation of data analysis.
This is because they make it easy to check the methods. Assumptions are easy to challenge and results verified in new analyses. Reproducible research pipelines extend traditional research. They do this by encoding the steps in a computer ‘scripting’ language and distributing the data and code with publications. Traditional research moves through the steps of hypothesis and design, measured data, analytic data, computational results (for figures, tables and numerical results), and reports (text and formatted manuscript).
Fundamental components of a reproducible research pipeline
The basic components of a pipeline are:
- Data Management Plan and Data Inventory
- Method steps
- Code
- Data storage
- Reports
- Distribution.
Method Steps
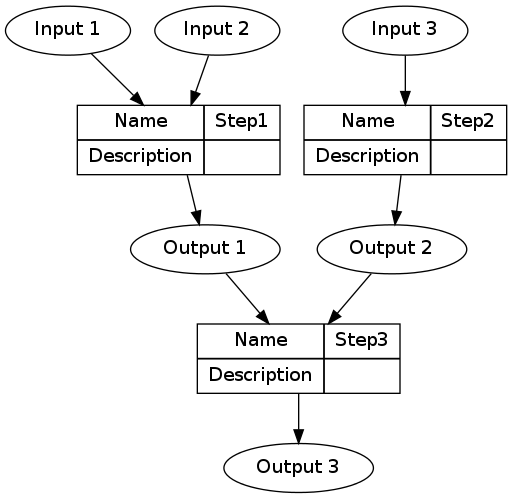
The method step is the key atomic unit of a scientific pipeline. It consists of inputs, outputs and a rationale for why the step is taken.
A simple way to keep track of the steps, inputs and outputs is shown in the Table below.
library(stringr)
steps <- read.csv(textConnection('
CLUSTER ,  STEP  , INPUTS                   , OUTPUTS
A  ,  Step1      , "Input 1, Input 2"       , "Output 1"
A  ,  Step2      ,  Input 3                  , Output 2
B  ,  Step3      , "Output 1, Output 2"      , Output 3
'), stringsAsFactors = F, strip.white = T)
The steps and data listed in the Table above can be visualised.
To achieve this an R function was written as part of this PhD project and is distributed in my own R package available on Github https://github.com/ivanhanigan/disentangle.
This is the newnode function. The function returns a string of text
written in the dot language which can be rendered in R using the
DiagrammeR package, or the standalone graphviz package. This creates the graph of this pipeline shown in Figure below. Note that a new field was added for Descriptions as these are highly recommended.
library(disentangle); library(stringr)
nodes <- newnode(indat = steps,   names_col = "STEP", in_col = "INPUTS",
  out_col = "OUTPUTS",
  nchar_to_snip = 40)
sink("fig-basic.dot");
cat(nodes);
sink()
# or DiagrammeR::grViz(nodes)
system("dot -Tpdf fig-basic.dot -o fig-basic.pdf")