Welcome to my Open Notebook

This is an Open Notebook with Selected Content - Delayed. All content is licenced with CC-BY. Find out more Here.

ONS-SCD.png

Centennial Scale Rainfall in Southeastern Australia

Droughts are extreme rainfall events on centennial scale

In the Hutchinson Drought Index project we used the longest period of rainfall data available because the drought index is based on the ranking of each six-month average of the distribution in the entire record of observations. A period as long as this is required to calculate extreme rainfall deficits. The original Hutchinson paper used a period 1920-1988 due to availability. Another consideration is the longer term characteristics of the rainfall epoch you are considering.

For example, in recent decades in Southeastern Australia annual total rainfal does not represent the longer term context very well. Shown in the image below is the result of an exploratory data analysis using rainfall data from the Murray Darling Basin (the ‘bread basket’ of Australian agriculture). I use the Classification And Regression Tree tool in the ‘rpart’ package to determine the optimal groupings. I’ve dropped the last two years of the sequence because when I first ran this analysis two years ago I got the result shown, but thankfully the last two years have given us very good rainfalls. This shows the difference between short-term and long-term rainfall patterns.

Regardless of this data ‘massaging’, in the analysis presented the annual trend over the first half of the twentieth century was lower than the recent fifty years, by about 60 millimeters on average. The 1930-1946 period was particularly dry, as has been the 1998-2008 period.

plot of seaust rainfall

Posted in  extreme weather events


How to explain my current research interests?

I’m having trouble explaining my current research interests.

I’m currently working on suicide and drought, heart disease and woodsmoke, violent deaths and heatwaves and a theoretical text on methods for rates, standardisation or adjustment in regression models.

Why? It’s complicated, but…

I have been working on a range of interrelated projects for the last few years that have revolved around the influence of climate on human health and wellbeing.
That might sound clear enough on first glance, but when we got stuck in to it we found we struggled to find very many health outcomes with really potent causal influences of climatic variables from the literature.

HUMAN HEALTH AND CLIMATE CHANGE IN OCEANIA: A RISK ASSESSMENT 2002

This all started with my involvement with the report 1 by Tony McMichael and Rosalie Woodruff. I was a research assistant and got my first taste of integrating data across population, health and environmental domains.

We did a great job, but after we’d completed that work, Colin and I reflected on how difficult it was to find those ‘low haning fruit’ that might be most easily analysted in this new direction of environmental epidemioligy. We then met Neville Nicholls from the BoM and found out that there was a strong suspicion of the increased risk of suicide during droughts amongst the meteorologists (to the point they were anxious about reporting unfavourable forecasting seasonal rainfall estimates based on the SOI and El Nino weather patterns). We ended up publishing a simple paper about that topic 2

Other health outcomes suggested themselves over the course of the following few years:

  • will be bullet points
  • includes Ross River Virus in WA
  • heart disease and woodsmoke
  • violent deaths and heatwaves
  • a theoretical text on methods for rates, standardisation or adjustment in regression models

So I am struggling to get a succint statement that reflects the current focus of my research interests. Luckily my core reasearch interest is simpler: better understanding the dynamics of the many systems involved in human ecology.

Posted in  research methods


Historical GIS evidence of Dengue in the far southeast of Australia?

Dengue Fever (DF) and climate

DF is a mosquito borne virus that has high public health impact and is potentially strongly influenced by climate.

There is an interesting story attached to this map from a paper by Russell et al 2009 1 that draws together documentary references to historic Dengue Fever (DF) transmission, some as far south as Gosford and Bourke in NSW.

Russel map of Dengue Virus

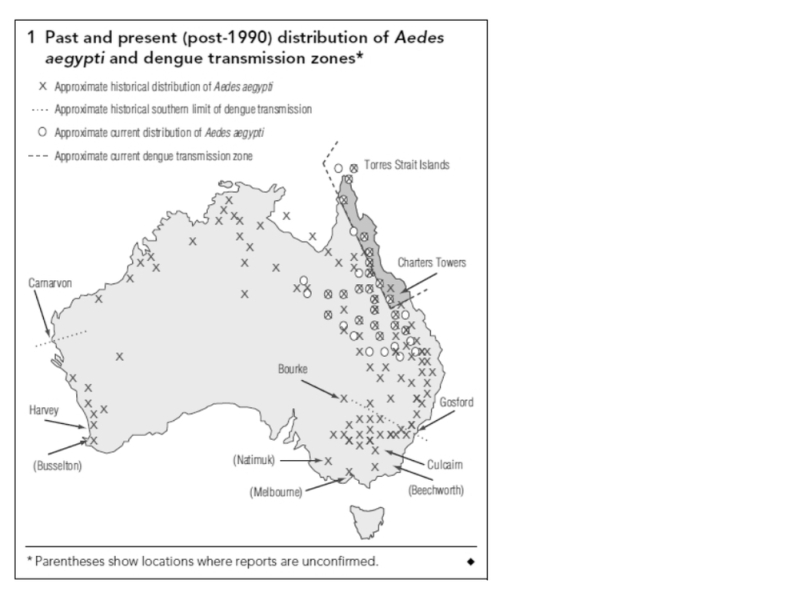
This asserted southerly extent is much further south than that delineated in the Potential Climatic Niche model of Hales et al 2002 2 and is used as a basis to refute the veracity (and utility) of such a model.

The Hales’ model determined the potential transmission zone in Australia as being constrained much further north by levels of humidity (vapour pressure). That predictive model was based on a regression of many climatic attributes of all locations of disease transmission in a global database. There is an ongoing debate between the epidemiology and the entomology camps over this modelling.

A key issue regarding this contentious map is a reference used by Russell et al 1 to dengue transmission having occurred inland at Bourke (30 S) and on the coast at Gosford (33 S, 80 km north of Sydney) in the first half of the 1900s, (ref 13 Lee et al, 1987 & ref 14 Lumley and Taylor 1943 ). However, a text search of Lee et al revealed only one reference to Gosford and that refers to the presence of vector mosquito Aedes aegypti (AE), but not dengue transmission.

The second reference is by the entomologist Frank H Taylor who mentions Brooklyn NSW, on page 158 (paragraph 2) .. as “the most southerly discovered location of AE” (the vector of DF in this area). Now, Brooklyn is on the railway on the Hawkesbury just south of Gosford. Taylor talks about railways spreading the vector. Maybe AE was found in NSW in conjunction with steam trains and railway water tanks for steam trains (the railway to Bourke was opened in 1885). There is no clear discussion in Lumley and Taylor of DF transmission around Brooklyn.

It is possible that the references cited for this map are really just evidence of the vector distribution, not actual virus transmission. It is also likely that the southern-most border of the AE vector would not be the southern-most fringe of DF transmission. This therefore casts doubt on Russell’s map which suggests the southern limit of DF transmission to have been as far south as Gosford and Bourke in NSW (Bourke is also asserted by Russell et al as a known transmission site using these same references).

What Russell may be doing is just connecting the two points - Brooklyn and Bourke (who knows if there is a single data point in between) and asserting that that line of southernmost AE proof is the southerly boundary of DF transmission. Perhaps if AE got to Brooklyn it might also have got to Bourke .. and Bourke being hotter than Brooklyn, DF transmission may have occurred there .. but we need more evidence than Russell et al provide.

(Thanks to my epidemiological friends for scouring the historical references with a thoroughly incredulous eye).

Posted in  spatial


Occam's Razor, Einstein's Razor and Chamberlin's Complex Thought

Introduction

I just read TC Chamberlin’s paper on the Method of Multiple Working Hypotheses and was very taken by the concept of Complex Thought:

“The use of the method leads to certain peculiar habits of mind which deserve passing notice, … it develops a habit of thought analogous to the method itself, … a habit of parallel or complex thought. Instead of a simple succession of thoughts in linear order, the procedure is complex, and the mind appears to become possessed of the power of simultaneous vision from different standpoints.”

I was struck by the difference in this method to the KISS or Keep It Sensibly Simple approach I’ve been taught (also sometimes misrepresented as Keep It Simple Stupid… that only applies to Stupid theories, in my view).

Occam’s Razor is a principle to Keep It Very Simple:

“to select among competing hypotheses that which makes the fewest assumptions and thereby offers the simplest explanation of the effect.”

Einstein’s Razor is a a warning against too much simplicity, with it’s exhortation that we can make it as simple as possible:

“without having to surrender the adequate representation of a single datum of experience”.

Complex Thought

I love the idea that I can train myself to acheive a kind of Science Zen that unveils all kinds of complex multifactorial causal mechanisms… but I fear the Danger of Vacillation Chamberlin speaks about:

“Like a pair of delicately poised scales, every added particle on the one side or the other produces its effect in oscillation. But such a pair of scales may be altogether too sensitive to be of practical value in the rough affairs of life”.

Posted in  disentangle things


The Shane-Weiss-Reich-White.worg approach to Code Management

Introduction

I’ve been thinking alot about workflows recently. I’m talking about the data, code, decisions etc bound up in the flow of material going through any project in the collective program of work we have going on at the Centre I work at. The group are facing tough questions about how we do things; and why. So in my reflections I’ve reviewed some links I’d saved and present below a unified summary version called the…

Shane-Weiss-Reich-White.worg approach

This a synthesis I’ve put together of approaches to managing code in complex data analysis projects. It’s named after key exponents on various blogs, wikis and web Q-and-A sites.

Stackoverflow user Shane posted this excellent comment to stackoverflow to:

“start off with one R file as you start a project (or a set of files like in the Bernd Weiss and Josh Reich examples), and progressively add to it (so that it grows in size) as you make discoveries.”

Bernd Weiss’ projects have:

  • analysis,
  • data and
  • document directories and
  • README.org (an Emacs org-mode file).

Bernd and Jeromy Anglim had an interesting discussion about this workflow in this post at stackexchange. Especially note that Bernd recommends that every publication, presentation or semester/class etc. has its own git repository. BUT that “there is one real downside: using the same dataset in different publications means to maintain different versions of ‘initialization code’ (define missing values, generate new variables etc.). To overcome this problem, Bernd decided to maintain ONE study/dataset-related repository which contains the original init-file. For each publication, presentation etc. use a copy of the original data-file as well as of the init-file (in R via file.copy()). Of course, whenever you create a new variable you’ll need to modify the original init-file and do a file.copy() (which is the most annoying part of the approach).”

Josh Reich breaks projects into 4 pieces:

  • load.R,
  • clean.R,
  • func.R and
  • do.R

John Myles White’s leads the ProjectTemplate package that has ‘create.project(minimal = TRUE)’ which creates the layout:

  • cache,
  • config,
  • data,
  • munge,
  • src, and
  • README

I’ve just added reports. If a project is a little bit bigger than minimal I’ll add admin, metadata, versions etc etc. I contributed that idea to the ProjectTemplate discussion list… but those guys seem to mostly use the default minimal = FALSE which creates all the possible directories including reports. I’ll try to keep it simple and just bolt on whatever bits suit my needs as I go.

Which Code Editor is the Best?

And finally the meta work holding the project together is the code editor. Despite the old joke which describes Emacs as “a great operating system, lacking only a decent editor”, this editor has killer functions for managing code. Check out worg the Emacs Org-Mode Community. Recently proponents of worg wrote this article. Previously I’ve REALLY enjoyed NPPtoR (only available under windoof).

In the words of JD Long in response to Shane “The choice of the specific tool is more idiosyncratic and not near as important as using SOMETHING.”

Posted in  disentangle things