Welcome to my Open Notebook

This is an Open Notebook with Selected Content - Delayed. All content is licenced with CC-BY. Find out more Here.

ONS-SCD.png

librarians-and-python

I stumbled on these posts about python and IPython Notebook by “Data Scientist Training for Librarians”:

I;ve been wanting to learn more python. I don’t think it’ll be ready for statistical modelling for a while, but I a want to be ready when it is. You can get my ipython notebook file for this here: olive.ipynb, but first run the following R code snippet to get the replication dataset ‘olive.csv’ into your home directory.

R Code: get the olive oil dataset

install.packages("pgmm")
require(pgmm)
data(olive)
names(olive) <- tolower(names(olive))
str(olive)
write.csv(olive, "olive.csv", row.names = F)
# actualy home might be easier for ipython to access
write.csv(olive, "~/olive.csv", row.names = F)

OK now reproduce the example

I quite like the histograms from the second example. Here is the raw code extracted from the ipynb

Code:

%pylab inline
import numpy as np
import matplotlib.pyplot as plt
import pandas as pd
import matplotlib.colors as colors
 
acidlist=['palmitic', 'palmitoleic', 'stearic', 'oleic', 'linoleic', 'linolenic', 'arachidic', 'eicosenoic']
dfsub=df[acidlist].apply(lambda x: x/100.0)
dfsub.head()
 
rkeys=[1,2,3]
rvals=['South','Sardinia','North']
rmap={e[0]:e[1] for e in zip(rkeys,rvals)}
rmap
 
fig, axes=plt.subplots(figsize=(10,20), nrows=len(acidlist), ncols=1) # sets up the framework for the graphs. Acidlist is defined elsewhere, and is a list of the acids we’re interested in.
i=0 # Sets a counter to 0
 
for ax in axes.flatten(): # Starts a loop to go through our plot and render each row
 
    acid=acidlist[i]
    seriesacid=df[acid] # creates seriesacid and sets it to df[acid], a list of the percent composition of the acid in the current iteration that’s in each olive oil.
 
    minmax=[seriesacid.min(), seriesacid.max()] # the minimum and maximum values plotted will be the minimum and maximum percentages that we find in the data
 
    for k,g in df.groupby('region'):  # starts a loop in the loop to plot the values by region
        style = {'histtype':'stepfilled', 'alpha':0.5, 'label':rmap[k], 'ax':ax}
        g[acid].hist(**style)
 
        ax.set_xlim(minmax)
 
        ax.set_title(acid)
 
        ax.grid(False)
 
        #construct legend
        ax.legend()
    i=i+1 # increments the counter, to move the loop on to the next acid.
 
    fig.tight_layout()
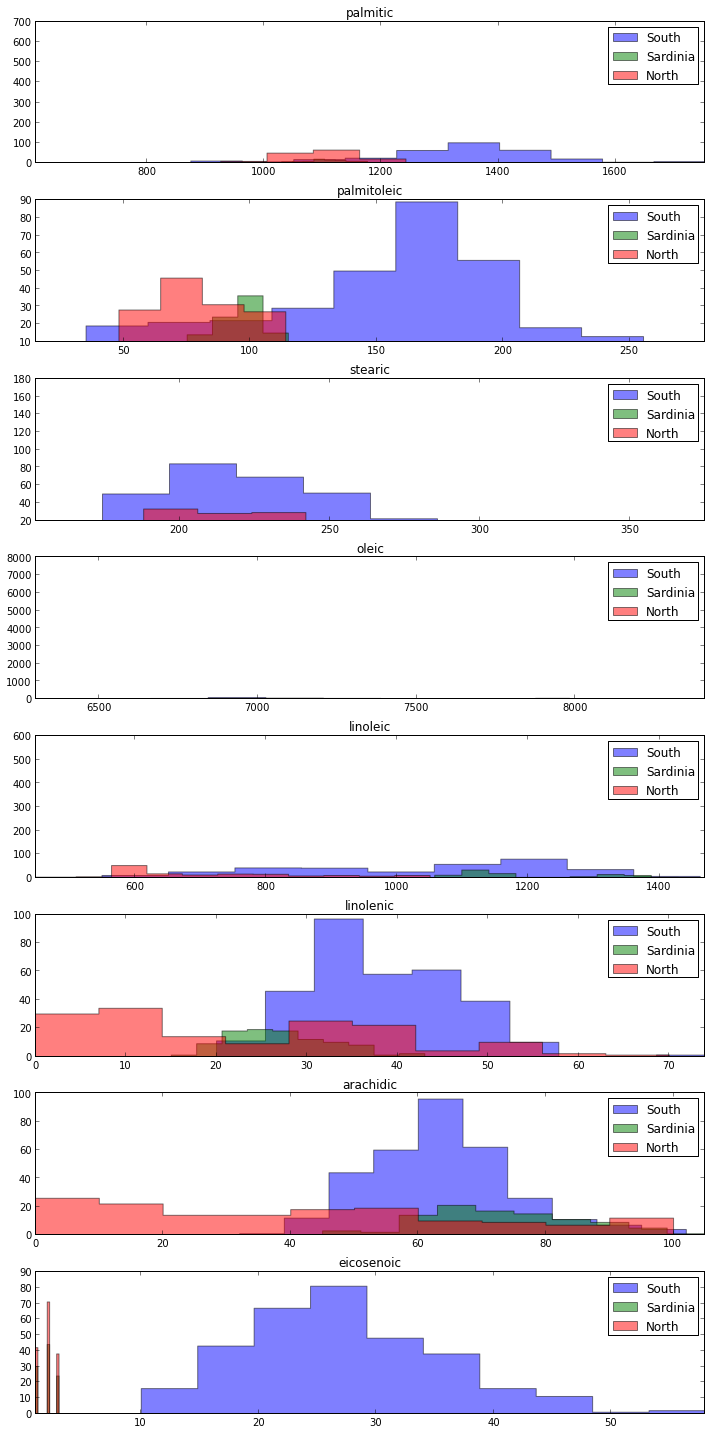
acid.png

Conclusions

  • I am not sure how to do the transparency but the rest of it would make more sense to me with R
  • Will try to reproduce in R for head-to-head shoot out.
  • I also plan to look into the new shinyAce browser based R editor for similar work
  • I’m still really enjoying Emacs Orgmode for this kind of functionality though and thoroughly recommend KJ Healy’s starter kit
  • (I’ve installed and config thison Ubuntu, Windoze and Mac, but LaTeX and exporting R code can be tricky)

Posted in  Data Documentation


handling-survey-data-with-r

R is generally very good for handling many different data types but

R has problems with survey data

This post is a stub about what packages Ive found with methods allowing to handle efficiently survey data: handle variable labels, values labels, and retrieve information about missing values

Base R:

## Not run:
require(foreign)
analyte  <- read.spss(filename, to.data.frame=T) 
varslist <- as.data.frame(attributes(analyte)$variable.labels)
# this gives a pretty useful thing to use

While I was digging around in TraMineR I found this link to Dataset, Emmanuel Rousseaux’s package for handling, documenting and describing data sets of survey data.

Code:Dataset, a package for handling-survey-data-with-r

if(!require(Dataset)) install.packages("Dataset", repos="http://R-Forge.R-project.org");
require(Dataset)
data(dds)
str(dds)
# cool
description(dds$sexe)
# excellent!

Conclusions

I’m sure there are plenty of other approaches. I’ll add them as I find them’

Posted in  Data Documentation


Github And Reproducible Research Report Casestudy Hutchinson Drought Index

Background

This is an example of using github for a Reproducible Research Report (RRR) using a casestudy of the Hutchinson Drought Index. The project is available under GNU licence at https://github.com/ivanhanigan/HutchinsonDroughtIndex.

Aims

This example will clone the repository from github and run the replication codes using the replication datasets.

Materials and Methods

  • assumes you are connected to the internet
  • assumes you have git, a github account and ssh key set up
  • assumes you have R and GDAL configured
  • assumes BoM and ABS have kept their data in the locations I specified to download from

Hutchinsons Drought Index

The Hutchinson Drought Index (or Drought Severity Index) is a climatic drought index that was designed to reflect agricultural droughts using only rainfall data.

The index was invented by Professor Mike Hutchinson at the ANU in 1992 (1) and this project includes R codes written to describe the calculations and also to download data (2,3) to play with.

Results

Replication Codes to run in the terminal

git clone git@github.com:ivanhanigan/HutchinsonDroughtIndex.git ~/data/HutchinsonDroughtIndex
R
setwd("~/data/HutchinsonDroughtIndex")
source("HutchinsonDroughtIndex_go.r")

  • WARNING this downloads 5.4MB from BoM and 19.9MB from ABS
  • This runs the codes and produces graphs
  • an alternative workflow would be to run the sweave file in the reports directory but I dont like that method as much and have set all the evaluation commands to false.
  • it will run now that we have the graphs though, to create a report:

Code:

setwd("reports")
Sweave("HutchinsonDroughtIndex_transformations_doc.Rnw")

  • which creates a tex file that can create this pdf
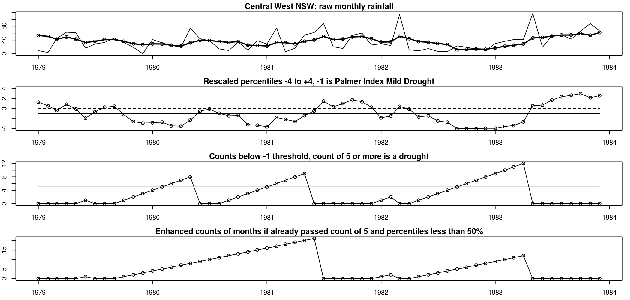
  • but the simplest example I gave above will compute the index and create the graphs (one is shown below)

CentralWestDrought8283.png

So what actually happened?

  • This project adheres to the Reichian LCFD model of writing R code
  • In this the code is bundled into modules Func (tools), Load, Do, Clean (check). These live in the src directory (following teh White ProjectTemplate model - well almost, He would put tools/func into lib)
  • then a main.r (or go.r) script calls these modules

go.r

 source('src/HutchinsonDroughtIndex_tools.r')
 source('src/HutchinsonDroughtIndex_load.r')
 source('src/HutchinsonDroughtIndex_do.r')
 source('src/HutchinsonDroughtIndex_check.r')

  • The really interesting bit is a tool written for this project that is called from within tools.r

    source(‘src/HutchinsonDroughtIndex_tools_droughtIndex.r’)

  • A keen reader would look in that script to find out exactly what the function does
  • A keen author would push that function to an R package (a super keen bean would publish this on CRAN)

Discussion

Strengths:

  • full codes are provided to reproduce the data access, manipulation and analysis
  • the gory details are hidden from the casual user

Weaknesses:

  • the important details are hidden from the technical user
  • the script depends on a bunch of things that might not be true

Conclusions

  • This is an example of a self-contained RRR

References

  1. Smith, D. I, Hutchinson, M. F, & McArthur, R. J. (1992) Climatic and Agricultural Drought: Payments and Policy. (Centre for Resource and Environmental Studies, Australian National University, Canberra, Australia).
    http://fennerschool-research.anu.edu.au/spatio-temporal/publications/cres_paper1992.pdf

  2. Bureau of Meteorology High Quality Monthly precipitation data downloaded on 2012-01-09 from ftp://ftp.bom.gov.au/anon/home/ncc/www/change/HQmonthlyR/HQ_monthly_prcp_txt.tar

  3. Australian Bureau of Statistics Statistical Divisions 2006 downloaded on 2012-01-09 from http://www.abs.gov.au/AUSSTATS/abs@.nsf/DetailsPage/1259.0.30.0022006?OpenDocument

Acknowledgements

Financial support was provided by Professor Tony McMichael’s “Australia Fellowship” from the the National Health and Medical Research Council, via the National Centre for Epidemiology and Population Health, Australian National University.

Posted in  climatic and agricultural drought


climatic-drought-guestpost-by-luciana-porfirio

Guest post by Luciana Porfirio with code contributions by Francis Markham

  • Recently I encountered a student doing an analysis who was doing everything in excel, and I couldn’t contain my mouth and say R would be better… but it isn’t a simple task. So any here are some tips.
  • There is a table with 62 years * 12 months of rain data in mm. We calculated the cumulative distribution using ecdf: empirical cumulative distribution function. So the table looks like this: Year Jan Feb Mach (…) each cell contains the cum dist.
  • We also got the number of months per year with less than X mm of rain. But he needs to know how many months are between the drought months, regardless the year. So, I thought that converting the data into a ts was going to facilitate the task, but it doesn’t, because now I don’t’ have columns and rows any longer.
  • But I struggled to handle a ts object to do for example an ifelse.
  • Luckily there are many many tricks about R, and with the code below we solved all his problems (and many months of work in excel).
  • Get the example data here
  • This is how it looks like:

R Code:

###############################################
require(reshape2)

###############################################
#read csv file with rain BoM data
dat = read.csv('raj_rain_data.csv')

fn <- apply(dat[,2:13], 2, ecdf) # equivalent to Excel's percentrank function, only for cols 2 to 13 but you need to apply the function to each month
 
#this fun does all the months at once
fn2 = data.frame(t(do.call("rbind", sapply(1:12, FUN = function(i) fn[[i]](dat[,i+1]), simplify = FALSE))))
colnames(fn2) = colnames(dat[,2:13])
fn2$year = dat$Year
 
#if the value is lower than 0.4, retrieves a 1, otherwise 0
fn2$drought = rowSums(ifelse(apply(fn2[,1:12], 2, FUN= function (x) x < 0.4)==TRUE, 1,0))
 
#if the value is lower than 0.1, retrieves a 1, otherwise 0
fn2$extreme = rowSums(ifelse(apply(fn2[,1:12], 2, FUN= function (x) x < 0.1)==TRUE, 1,0))
 
str(fn2)
names(fn2)
 
#ts didn't work - Francis suggested to melt the data.frame # Melt
#fn2 to tall data set
fn2.tall <- melt(fn2, id.vars="year")
 
# Get the year-month into date format
fn2.tall$date <- with(fn2.tall,
                             as.Date(paste("1", variable, year), "%d %b %Y"))
 
# Convert dates into months since 0 BC/AD (arbitrary, but doesn't
# matter)
#I'm not using the month.idx with Ivan's solution (remove)
fn2.tall$mnth.idx <- sapply(fn2.tall$date, function(x){
  12*as.integer(format(x, "%Y")) + (as.integer(format(x, "%m")) - 1)
})
 
# Sort by date
fn2.tall <- fn2.tall[order(fn2.tall$date),]
 
 
#Ivan's solution
 
x<-fn2.tall$value<0.4
xx <- (cumsum(!x) + 1) * x
x2<-(seq_along(x) - match(xx, xx) + 1) * x
fn2.tall$count<-x2
 
#counts the number of cases of drought
as.data.frame(table(fn2.tall$count))
###############################################
###############################################

Posted in  climatic and agricultural drought


quantum-gis-visualisations

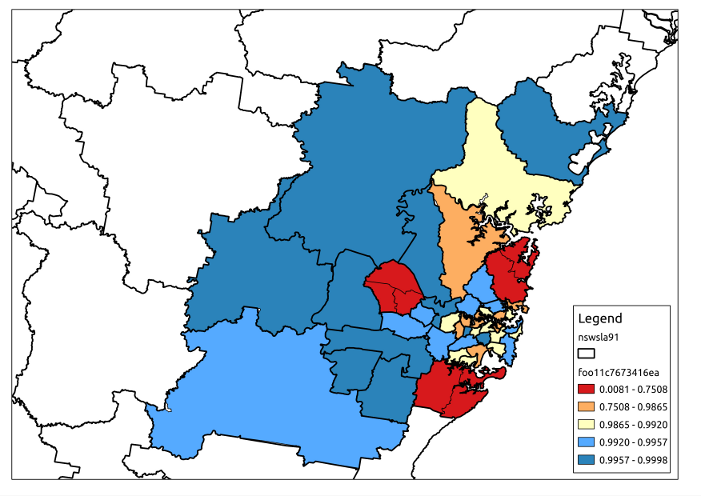
R Code: use postgis to create area-concordance

require(devtools)
install_github("gisviz", "ivanhanigan")
require(gisviz)
require(swishdbtools)
ch <- connect2postgres2("gislibrary")
# make a temporary tablename, to avoid clobbering
temp_table <- swish_temptable("gislibrary")
temp_table <- paste("public", temp_table$table, sep = ".")
temp_table
# this is going to be public.foo11c7673416ea
 
sql <- postgis_concordance(conn = ch, source_table = "abs_sla.nswsla91",
   source_zones_code = 'sla_id', target_table = "abs_sla.nswsla01",
   target_zones_code = "sla_code",
   into = temp_table, tolerance = 0.01,
   subset_target_table = "cast(sla_code as text) like '105%'", 
   eval = F) 
cat(sql)
dbSendQuery(ch, sql)

  • now connect to PostGIS using QGIS as described in this tute
  • and add the layer to the map
  • Style it how you like, I also added NSWSLA1991 over the top
  • go into the “new print composer”

qgis-new-print-composer.png

qgis-add-new-map.png

Results

  • hit the export to image and viola

qgis-export-image.png

Don’t forget to clean up the database!

R Code:

dbSendQuery(ch, sprintf("drop table %s", temp_table))

Posted in  spatial