Welcome to my Open Notebook

This is an Open Notebook with Selected Content - Delayed. All content is licenced with CC-BY. Find out more Here.

ONS-SCD.png

r-eml-pgis-setting-up-the-software-stack

r-eml

  • this is the R package for authoring EML

pgis

  • This is a spatial database

System Description

  • Ubuntu 12.04 LTS
  • Macpro Tower

EML is a useful beast

setting-up-the-software-stack

  • First I needed devtools and this required RCurl linux package dependencies

Code

sudo apt-get install libcurl libcurl-devel libcurl4-gnutls-dev

  • Now trying to install EML

Code

require(devtools)
install_github("EML", "ropensci")

  • then XML Depends

Code

sudo apt-get install libcurl4-openssl-dev libxml2-dev
sudo apt-get install r-cran-xml

  • rJava can be difficult, I was really dreading this but eventually stackoverflow to the rescue!

Code

sudo apt-get install openjdk-7-*
sudo apt-get install r-cran-rjava
update-java-alternatives -l
sudo update-java-alternatives -s java-1.7.0-openjdk-amd64 
sudo R CMD javareconf
R
install.packages("rJava")
library(rJava)

  • now complaining about ‘RHTMLForms’ and ‘RWordXML’

Code:

install_github("RHTMLForms", "omegahat")
install.packages("RWordXML", repos="http://www.omegahat.org/R", type="source")

  • on we go

Code

install.packages(c("knitr", "rfigshare", "testthat", "RCurl", "dataone", "rrdf"))

RGDAL

  • Spatial toolbox

Code

sudo apt-get update
sudo apt-get upgrade
sudo apt-get install libgdal1-dev libproj-dev
gdal-config --version
sudo R
install.packages("rgdal")

PostgreSQL 9.3

Code:

sudo apt-get update
sudo apt-get -y install python-software-properties
wget --quiet -O - https://www.postgresql.org/media/keys/ACCC4CF8.asc | sudo apt-key add -
sudo sh -c 'echo "deb http://apt.postgresql.org/pub/repos/apt/ precise-pgdg main" >> /etc/apt/sources.list.d/postgresql.list'
sudo apt-get update
sudo apt-get install postgresql-9.3 pgadmin3
sudo -u postgres psql
create role user_name login password 'passwd';
show hba_file ;
#/etc/postgresql/9.3/main/pg_hba.conf
\q
sudo nano /etc/postgresql/9.3/main/pg_hba.conf
# add users to listen for at the firewall
sudo nano /etc/postgresql/9.3/main/postgresql.conf
# listenaddresses = *
sudo services postgresql restart
sudo ufw allow from my.ip.address.0/24 to any port 5432

PostGIS 2.0

Code:

sudo apt-get update
sudo apt-get install postgresql-9.3-postgis-2.1 -f
sudo su
su - postgres
createdb postgis_ltern
psql -d postgis_ltern -U postgres  
CREATE EXTENSION postgis;  
CREATE EXTENSION postgis_topology;  
CREATE ROLE public_group;
CREATE ROLE ivan_hanigan LOGIN PASSWORD 'password';
GRANT public_group TO ivan_hanigan;
grant usage on schema public to public_group;
GRANT select ON ALL TABLES IN SCHEMA public TO public_group;
grant execute on all functions in schema public to public_group;
grant select on all sequences in schema public to public_group;
grant select on table geometry_columns to public_group;
grant select on table spatial_ref_sys to public_group;
grant select on table geography_columns to public_group;
grant select on table raster_columns to public_group;
grant select on table raster_overviews to public_group;

For transforming AGD 66 to GDA94

  • A special transformations grid file is required to be added to the PROJ.4 files for reprojecting the Australian projections AGD66 to GDA94.
  • Thanks to Joe Guillaume and Francis Markham for providing this solution.

Code: transformations grid for Australian projections

cd /usr/share/proj
wget http://www.icsm.gov.au/gda/gdatm/national66.zip  
unzip national66.zip
mv "A66 National (13.09.01).gsb" aust_national_agd66_13.09.01.gsb
su - postgres 
psql -d mydb

UPDATE spatial_ref_sys SET
proj4text='+proj=longlat +ellps=aust_SA +nadgrids=aust_national_agd66_13.09.01.gsb +wktext'
where srid=4202;
\q
exit

make a spatial dataset

Code

require(devtools)
install_github("swishdbtools", "swish-climate-impact-assessment")
require(swishdbtools)
require(ggmap)
 
ch  <- connect2postgres2("postgis_ltern")
 
location_names <- c("linnaeus way acton canberra act", "biology place acton canberra act")
locations <- geocode(location_names)
locations <- cbind(location_names, locations)
 
dbWriteTable(ch, "anu_gisforum_locations", locations, row.names = F)
sql <- points2geom("public", "anu_gisforum_locations", col_lat = "lat", col_long = "lon")
cat(sql)
dbSendQuery(ch,
            sql
            )

This can now be shown in Quantum GIS
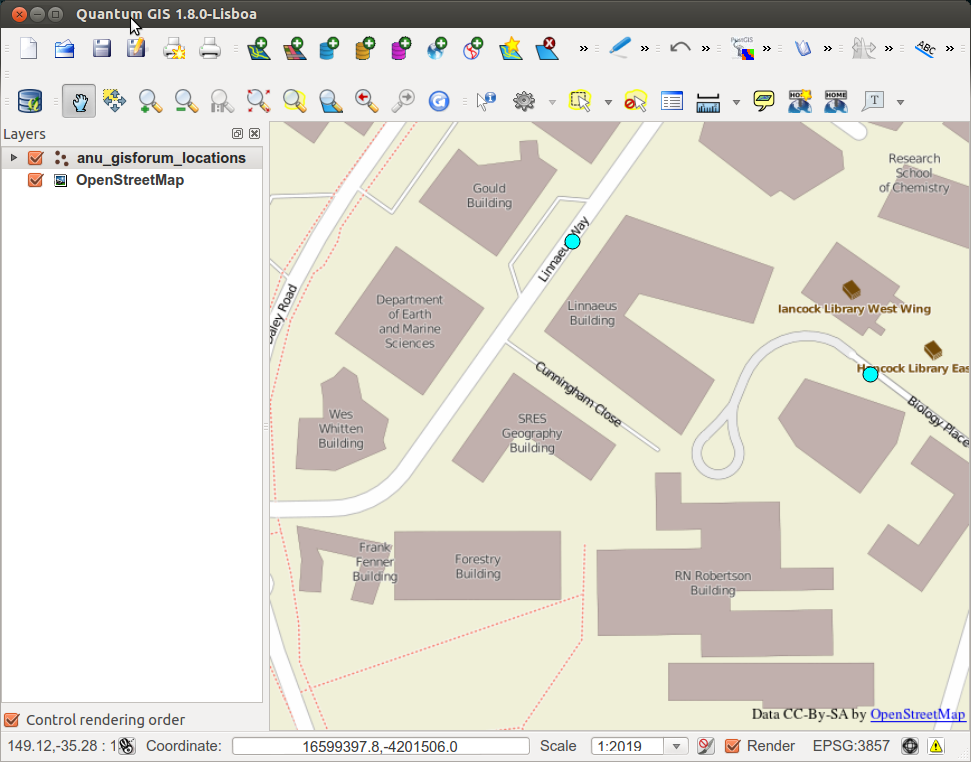
images/gisforum_locations.png

TODO:

  • add EML for this using R
  • finesse with Morpho (requires further Java shennanigans)
  • publish something to KNB using R dataone package

Posted in  disentangle


data-dictionary-function-needed-further-upgrades-to-my-misc-package

  • I’ve been enjoying summarising datasets with my data_dictionary function
  • There was a bug when a date variable had any missings.
  • I have modified the function to cope with these so have released version 1.2
  • Windows Version is Downloadable Here
  • Linux and Mac users can just run this R code

R Code:

require(devtools)
install_github("disentangle", "ivanhanigan")

Posted in  disentangle


data-dictionary-function-needed-upgrade-to-my-misc-package

  • Recently I got a lot of files with columns that are all missing. I had to modify the ‘data_dictionary’ function to cope with these so have released version 1.1
  • Windows Version is Downloadable Here
  • Linux and Mac users can just run this R code

R Code:

require(devtools)
install_github("disentangle", "ivanhanigan")

  • In my ‘disentangle’ package of miscellaneous tools, the data_dictionary function is designed to produce descriptive summary statistics in a familiar way to the FREQUENCIES command for SPSS
  • I chose to emulate the SPSS output because I think it is a pretty decent summary statistics table, and there are loads of users who have already been introduced to this style of output
  • I wrote it because I had not got exactly what I wanted from the reporttools or stargazer packages which also have similar summary stats functions
  • I chose to call it data_dictionary because I think that the alternatives (like ‘frequencise’ or ‘code_book’ are not as immediately intuitive as to what you get)
  • the function I wrote returns a data.frame with the variable name, a simplified type (character, number or date)

Code:data-dictionary-function-needed-upgrade-to-my-misc-package

# functions
require(devtools)
install_github("disentangle", "ivanhanigan")
require(disentangle)
require(xtable)

# load
fpath <- system.file("extdata/civst_gend_sector.csv", package = "disentangle")
fpath
civst_gend_sector <- read.csv(fpath)
civst_gend_sector$datevar <- as.Date(round(rnorm(nrow(civst_gend_sector), Sys.Date(),10)), origin = "1970-01-01")
civst_gend_sector$missing_blahblah_variable  <- NA

# check
str(civst_gend_sector)

#do
data_dict(civst_gend_sector, "civil_status")
data_dict(civst_gend_sector, "datevar")
data_dict(civst_gend_sector, "number_of_cases")
data_dict(civst_gend_sector, "missing_blahblah_variable")

dataDictionary <- data_dictionary(civst_gend_sector,
                                  show_levels = -1)

print(xtable(dataDictionary), type = "html", include.rownames = F)

Variable Type Attributes Value Count Percent
civil_status character divorced/widowed 6 33.33
married 6 33.33
single 6 33.33
gender character female 9 50.00
male 9 50.00
activity_sector character primary 6 33.33
secondary 6 33.33
tertiary 6 33.33
number_of_cases number Min. 0
1st Qu. 5
Median 9
Mean 15.17
3rd Qu. 17
Max. 50
datevar date Min. 2014-05-26
1st Qu. 2014-06-07
Median 2014-06-15
Mean 2014-06-14
3rd Qu. 2014-06-18
Max. 2014-07-05
missing_blahblah_variable missing NA's 18 100.00

Posted in  disentangle


reflecting-on-aekos-data-portal-test

  • In my last post on AEKOS Dta Portal I reported my test of the Australian Terrestrial Ecosystem Research Network (TERN) AEKOS Data Portal system implemented by Uni Adelaide’s Eco-informatics Facility.
  • I’ve reflected a bit on this process and I want to jot down some notes

Database restore scripts are complicated and inhibit access

  • I’d re-iterate my conclusion that I really like how this model emphasises the use of databases for data management (and postgres or mysql are great options)
  • but for a less-technically savvy person or for a casual browser just looking for some quick data to play with this is not easy enough
  • for a good description of alternative approaches see http://flowingdata.com/2014/06/10/how-to-make-government-data-sites-better/ which is a good set of requests for simple and efficient access to data via Government portals in the USA
  • I spoke with Squid and Matt the developers and they described the new enhancement they are working on now to provide a simple flat file download so that will be great.

Linking Exploratory Data Analyses back to metadata and source data documentation

  • In my normal mode of operating I spend more time reviewing the metadata and source data documentation before exploring data (much like the workflow described at http://simplystatistics.org/2014/06/13/what-i-do-when-i-get-a-new-data-set-as-told-through-tweets/, especially see Step 1: Learn about the elephant)
  • but this time I just wanted to get some data out and so went full steam ahead like a bull at a gate
  • Once I had my map visualisation done I decided to go back to the documentation to read up a bit more on why these locations were studied and other contextual metadata
  • But when I look in the zip I downloaded I investigated the citation.pdf and the tabledefinitions.pdf but these don’t really have much in it for me to link back to the source of the data and the documentation I need
  • See the citation link h ref=”http://www.portal.aekos.org.au/” target=”_blank”
  • so hunting around the portal again I search for the survey name “Department of Environment, Water and Natural Resources, South Australia - Dalhousie Survey (Scientific Expedition Group) Survey”
  • and got 10 hits, chose number 1
  • skim-read of overview and scope. seems the link out from the overview/abstract is the most useful to get an overview
  • moved on to methods and I really like the way the segments collapse and expand as you read them, but didn’t like how I had to keep navigating back and forward with the browser (like between Study Location Selection Method and Study Location Visit Method, each time I went back I had to scroll to bottom of page to get to list of sections)
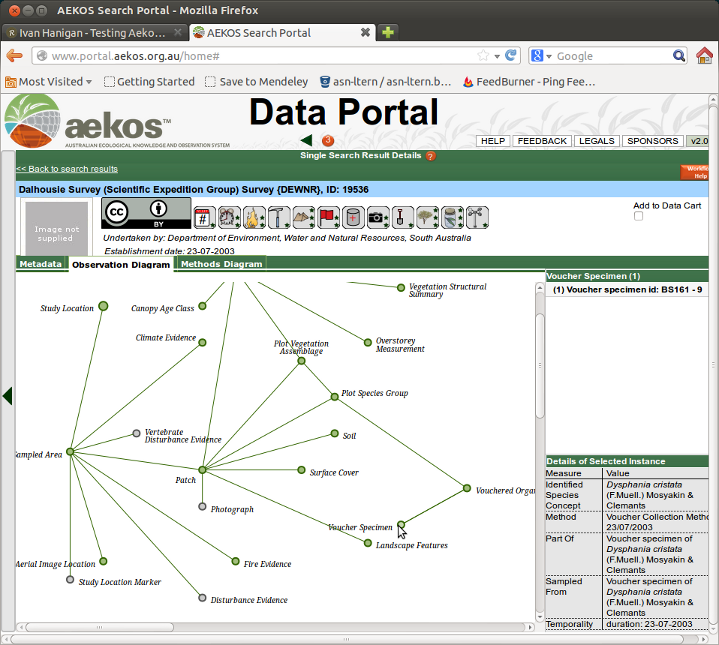
  • Finally I got to explore the observation diagram and methods diagram which I have not seen before. These seem like a great way to show the information and let people browse through the concepts etc…
  • But I think I still prefer an old school document with a table of contents and some kind of index.

aekos_obs_diagram.png

Posted in  Data Documentation


my-feed-filesize-is-larger-than-512k-need-to-reduce-its-size-in-order-for-feedburner-to-process-it

  • I am not sure but I suspect this post caused my feedburner xml to become too big and stop the updates to my feedly account
  • Found this out by logging in to http://feedburner.google.com and trying to re-sync my feed (under troubleshootize)
  • I may have tipped the size over the edge with this post
  • the issue is probably due to me starting to use knitr (see this post ) to produce the HTML reports which encodes the images inline, whereas I used to use the old school orgmode approach of referencing the png in the images directory
  • looking at the feed/index.xml I saw that this includes every post I ever wrote
  • I fixed it by going back to the instructions I used to set up the feed
  • and adding limit:10 to the line of the loop ‘for post in site.posts’

Posted in  Data Documentation