Reproducibility
- A subset of the data and code used for this blog post is available at https://github.com/ivanhanigan/aggregation-of-slas-or-sa2s
- Some parts of the data I used are not available due to shared Intellectual Property
- The spatial data and SEIFA Socioeconomic index data are publicly available from the Australian Bureau of Statistics
- The New Groups categories were generously contributed by John Glover of the Public Health Information Development Unit, The University of Adelaide.
Introduction
The Aim is to aggregate Statistical Local Areas (SLAs, recently relabelled SA2) Australian Standard Geographical Classification (ASGC, recently relabelled ASGS) to achieve a greater level of privacy protection. The rules to achieve a geography amenable to statistical comparisons are:
- similar populations (around 20,000 to 30,000)
- homogenous Index of Relative Socioeconomic Disadvantage
- nested within the next level up in the ASGC/ASGS
- so that SSD (recently relabelled SA3) are not split.
- the SA2s can be aggregated through a process of assigning alike areas to groups, and reviewing/adjusting these assignments
- This document contains some suggestions for adjusting groupings to better reflect differences in the level of disadvantage, while still adhering to the rules outlined.
Results
Data Prep
- The data were prepared as spatial files
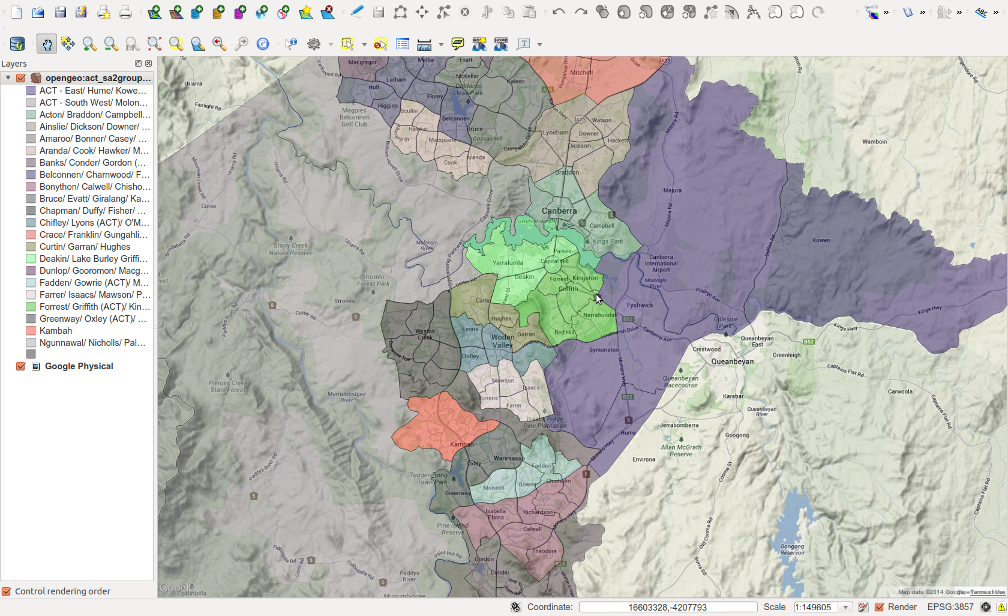
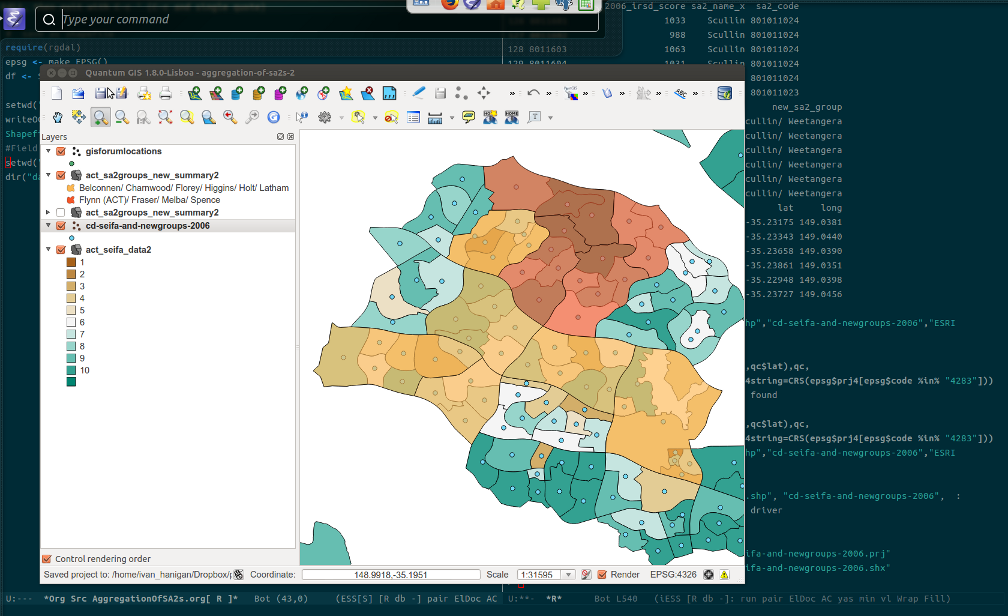
Assess proposed split in Belconnen
- the proposed split in belconnen looks good
- This involves splitting Belconnen West (old SLA group) into two regions. The first generally has much higher proportion of individuals in a bottom quintile SES score
- Group 1 = Belconnen/ Charnwood/ Florey/ Higgins/ Holt/ Latham
- Group 2 = Flynn (ACT)/ Fraser/ Melba/ Spence
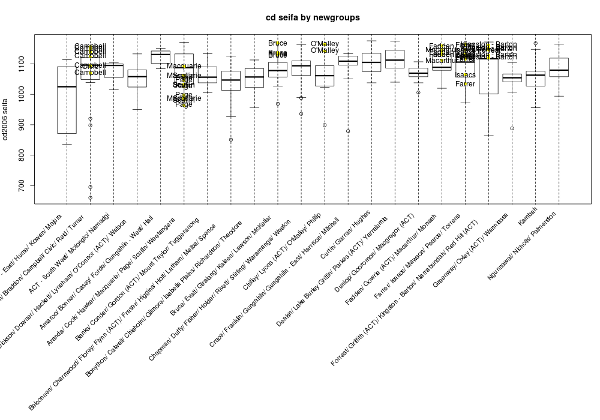
Assess the outliers
- this can be done by identifying their component CCD SEIFA within new groups
- the seifa of CCD in outliers are compared to the others within their new groups
- zoom in on croweded areas
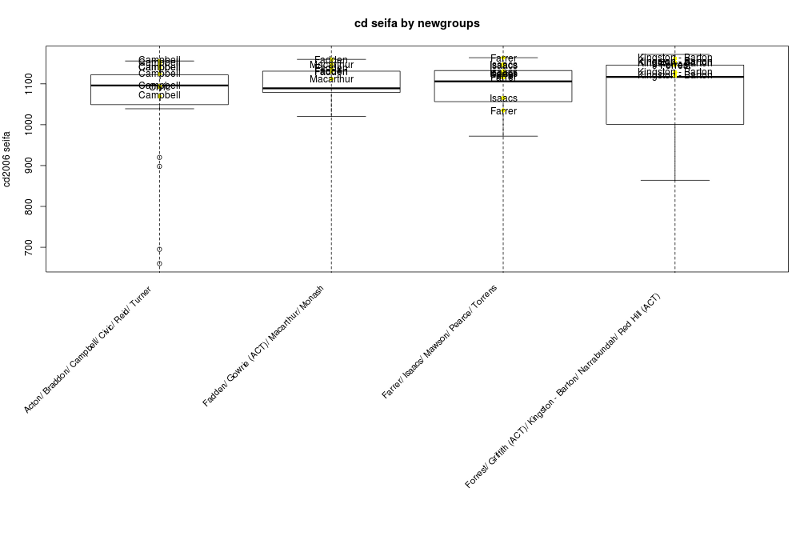
| sa2_name.x | new_sa2_group | notes | |
|---|---|---|---|
| 12 | Bruce | Bruce/ Evatt/ Giralang/ Kaleen/ Lawson/ McKellar | higher than neighbours |
| 14 | Campbell | Acton/ Braddon/ Campbell/ Civic/ Reid/ Turner | ok |
| 20 | Civic | Acton/ Braddon/ Campbell/ Civic/ Reid/ Turner | ok |
| 31 | Fadden | Fadden/ Gowrie (ACT)/ Macarthur/ Monash | ok |
| 32 | Farrer | Farrer/ Isaacs/ Mawson/ Pearce/ Torrens | higher than neighbours bar one ccd |
| 37 | Forrest | Forrest/ Griffith (ACT)/ Kingston - Barton/ Narrabundah/ Red Hill (ACT) | higher than neighbours |
| 60 | Isaacs | Farrer/ Isaacs/ Mawson/ Pearce/ Torrens | higher than neighbours bar one ccd |
| 64 | Kingston - Barton | Forrest/ Griffith (ACT)/ Kingston - Barton/ Narrabundah/ Red Hill (ACT) | higher than neighbours |
| 71 | Macarthur | Fadden/ Gowrie (ACT)/ Macarthur/ Monash | ok |
| 73 | Macquarie | Aranda/ Cook/ Hawker/ Macquarie/ Page/ Scullin/ Weetangera | ok |
| 87 | O'Malley | Chifley/ Lyons (ACT)/ O'Malley/ Phillip | higher than neighbours |
| 89 | Page | Aranda/ Cook/ Hawker/ Macquarie/ Page/ Scullin/ Weetangera | ok |
| 98 | Scullin | Aranda/ Cook/ Hawker/ Macquarie/ Page/ Scullin/ Weetangera | ok |
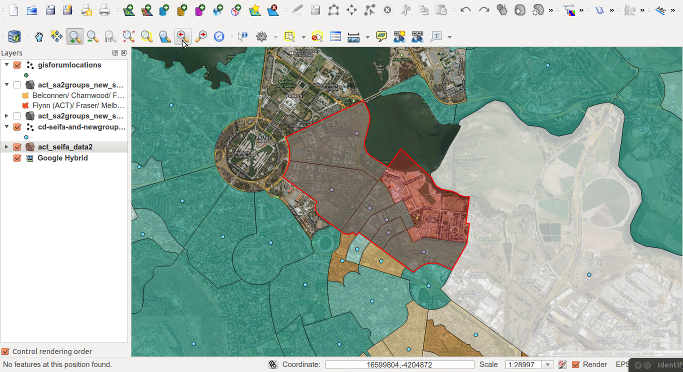
Investigating areas: eg the Kingston - Barton area
- we can zoom in on some of these areas
Conclusions
Basically, the problem comes from public housing policies in Canberra which distorts the effect of the housing market and land values in segregating rich from poor. Essentially, there are highly advantaged suburbs with pockets of disadvantaged public housing.
Other ‘problematic’ features re this are:
- proximity to ornamental lakes
- proximity to urban green space
- proximity to rural residential hubs (walaroo road? hall?). This is a bit of a reverse statement – but different to ‘distance from urban centre’
- elevation, especially with a view.
Potentially the issue is going to be that this can’t be solved if you want to maintain SA2 as the base level - the distinctions are going to be at an SA1 or even mesh block level.


