
Sometime ago I saw this example of a method for assessing missing data in a large data frame http://flowingdata.com/2014/08/14/csv-fingerprint-spot-errors-in-your-data-at-a-glance/
I asked my colleague Grant about doing this in R and he whipped up the following code to generate such an image:
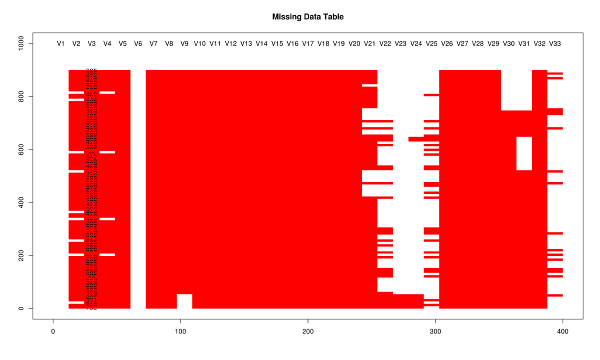
Code
misstable <- function(atable){
 op <- par(bg = "white")
 plot(c(0, 400), c(0, 1000), type = "n", xlab="", ylab="",
     main = "Missing Data Table")


 pmin=000
 pmax=400
 stre=pmax-pmin
 lnames=length(atable)
 cstep = (stre/lnames)
 for(titles in 1:lnames){
 text((titles-1) * cstep+pmin+cstep/2,1000,colnames(atable)[titles])
 }

 gmax=900
 gmin=0
 gstre=gmax-gmin
 rvec = as.vector(atable[ [ 1 ] ])
 dnames=length(rvec)
 step = gstre / dnames
 for(rows in 1:dnames){
 text(30,gmax - (rows-1)*step-step/2,rvec[rows])
 ymax=gmax - (rows-1)*step
 ymin=gmax - (rows)*step
 for(col in 2:lnames-1){
 if(atable[rows,col+1] == F){
 tcolor = "red"
 }
 if(atable[rows,col+1] == T){
 tcolor = "white"
 }
 rect((col) * (stre/lnames)+pmin, ymin, (col+1) * (stre/lnames)+pmin,
 ymax,col=tcolor,lty="blank")
 }
 }
}

require(grDevices)

# Make a quick dataframe with true/false representing data availability
locs=c("Australia","India","New Zealand","Sri Lanka","Uruguay","Somalia")
f1=c(T,F,T,T,F,F)
f2=c(F,F,F,T,F,F)
f3=c(F,T,T,T,F,T)
atable=data.frame(locs,f1,f2,f3)
atable
#Draw the table.
misstable(atable)


