
I use the R package DiagrammeR for creating graphs (the formal kind, connecting nodes with edges)
- This package is great and I like how it interacts with the Graphviz program
- One thing that I like to do in planning and organising data analysis projects is to make graphs and lists of the methods steps, inputs and Outputs
- A simple way to organise these things is in a dataframe (table) with a column for each step (node) and two others for inputs and outputs (edges)
- In my utilities R package
github.com/ivanhanigan/disentangleI have written functions that turn this table into a graphiviz DOT language script - Recently I have needed to unpack the list for a more itemized view
- Both these functions are showcased below
Code: newnode
# First create some test data, each step is a collection of edges
# with inputs or outputs simple comma seperated lists
dat <- read.csv(textConnection('
cluster ,  step    , inputs                    , outputs                                , description
A  ,  siteIDs      , "GPS, helicopter"          , "spatial, site doco"                 , latitude and longitude of sites
A  ,  weather      , BoM                       , exposures                              , weather data from BoM
B  ,  trapped      , spatial                   , trapped_no                             , counts of species caught in trap
B  ,  biomass      , spatial                   , biomass_g                              ,
B  ,  correlations , "exposures,trapped_no,biomass_g" , report1                         , A study we published
C  ,  paper1       , report1                   , "open access repository, data package" ,
D  ,  biomass revision, new estimates          , biomass_g                              , this came late
'), stringsAsFactors = F, strip.white = T)
str(dat)
# dat

# Now run the function and create a graph
nodes <- newnode(
  indat = dat,
  names_col = "step",
  in_col = "inputs",
  out_col = "outputs",
  desc_col = "description",
  clusters_col = "cluster",
  nchar_to_snip = 40
  )
sink("Transformations.dot")
cat(nodes)
sink()
#DiagrammeR::grViz("Transformations.dot")
system("dot -Tpng Transformations.dot -o Transformations.png")
browseURL("Transformations.png")
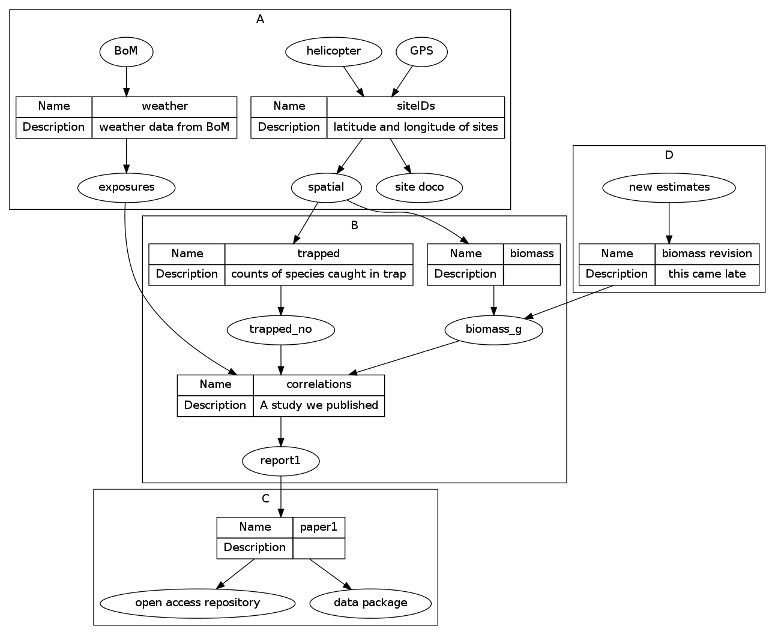
That creates this diagram
Now to showcase the tool that itemizes this list of inputs and outputs
- The original table has no capacity to add detail about each node as they are held as a list of inputs and outputs
- To add detail for each we need to unpack each list and create a new table with one row per node
- I decided to make this a long table with an identifier for each node about which step (edge) the node is an input or an output
Code: newnode_csv
nodes_graphy <- newnode_csv(
  indat = dat,
  names_col = "step",
  in_col = "inputs",
  out_col = "outputs",
  clusters_col = 'cluster'
  )
# which creates this table
knitr::kable(nodes_graphy)
|cluster |name             |in_or_out |value                  |
|:-------|:----------------|:---------|:----------------------|
|A       |siteIDs          |input     |GPS                    |
|A       |siteIDs          |input     |helicopter             |
|A       |siteIDs          |output    |spatial                |
|A       |siteIDs          |output    |site doco              |
|A       |weather          |input     |BoM                    |
|A       |weather          |output    |exposures              |
|B       |trapped          |input     |spatial                |
|B       |trapped          |output    |trapped_no             |
|B       |biomass          |input     |spatial                |
|B       |biomass          |output    |biomass_g              |
|B       |correlations     |input     |exposures              |
|B       |correlations     |input     |trapped_no             |
|B       |correlations     |input     |biomass_g              |
|B       |correlations     |output    |report1                |
|C       |paper1           |input     |report1                |
|C       |paper1           |output    |open access repository |
|C       |paper1           |output    |data package           |
|D       |biomass revision |input     |new estimates          |
|D       |biomass revision |output    |biomass_g              |
This can now be useful for making a ‘shopping list’ of the data to aquire, transform, analyse or archive.


