
Aims
I have worked on a function that turns a data.frame into a graphviz code in the dot language, with some of my preferred settings. I realised that it might be useful for causal directed acyclic graphs.
Causal diagrams are useful for conceptualising the pathways of cause and effect. These diagrams are sometimes simplly informal pictures but have also been developed in a more formal way to be used in modelling. These formal developments use concepts derived from the mathmatical abstraction of Graphs (fundamentally Graphs are networks of linked ‘nodes’, with the links being termed ‘edges’). Causal diagrams can either be constructed to depict two things: first are feedback loops (a vexatious property of complex systems that confounds modelling) while second are more simple chain-of-events type pathways which proceed from an upstream cause to a downstream effect in a single direction, without cycles, called ‘Directed Acyclic Graphs or DAGs. The loop diagrams are out of the scope of this present blog post because the DAGs are much more easily addressed by the tool that I am describing.
To begin I am going to build on this other guy’s blog post on causal DAGs with R http://donlelek.github.io/2015/03/31/dags-with-r/ I wanted to add an interface for building these.
Some background to the concepts that I use are provided in the references below.
Materials and Methods
The DiagrammeR package which has been integrated within R-Studio has made access to the graphing tool graphviz much easier than it used to be. My function causal_dag (avaiable in my disentangle github package) essentially constructs the required nodes and edges for that package to use. Optionally we can also include labels to indicate the direction of the effect.
To use the tool all you need to do is create a list of edges and their associated inputs nodes and outputs nodes (as a comma separated values string) shown in the picture below.
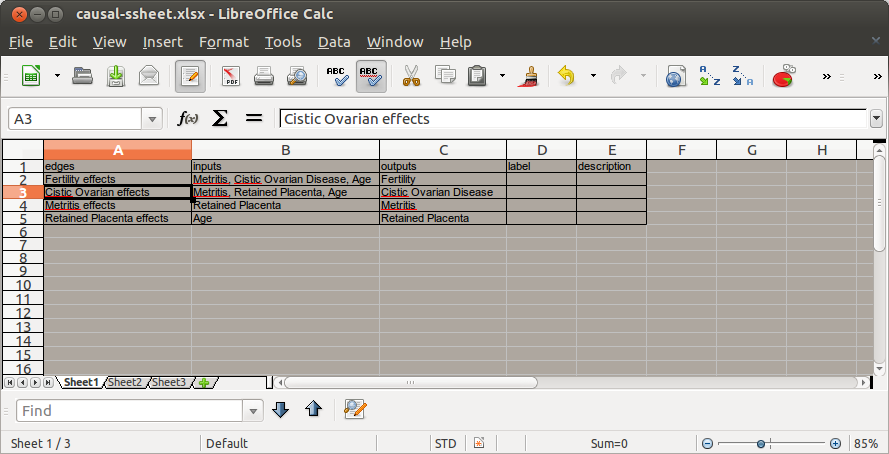
Code:
# read in the sheet
library(disentangle)
library(stringr)
causes <- readxl::read_excel("causal-ssheet.xlsx")
causes
nodes <- newnode(causes, "edges", "inputs", "outputs")
cat(nodes)
# The result is a formated graph in the dot language with some of my
# preferred settings such as edges showing as 'records' and a spot to
# write a description or include literature about each process
- See the DOT code in the Appendix
- to render the graph now DiagrammeR can use this text string R object to render this to SVG
- I think it does not do PNG or PDF though so I still use graphviz and dot directly
Code:
grViz(nodes)

# But I also use graphviz directly to produce a publishable image in
# pdf or png
sink("reproduce-donlelek.dot")
cat(nodes)
sink()# If graphviz is installed and on linux call it with a shell command
#system("dot -Tpdf reproduce-donlelek.dot -o reproduce-donlelek.pdf")
system("dot -Tpng reproduce-donlelek.dot -o reproduce-donlelek.png")
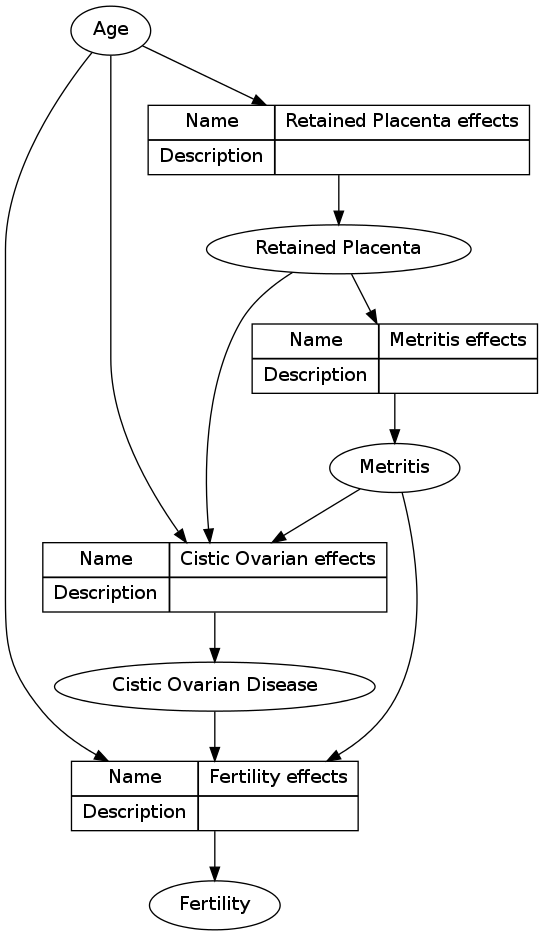
Results
Here I have reproduced the work of donlelek
Future directions
- I’d like to make the edges implicit, so that the spreadsheet keeps track of the information about the causal process, but the graph just shows the lines connecting the nodes
- The edges are where the action is, so I need to add a direction of effect. This would be in a
labelcolumn and added in a [ label = ‘abc’ ] tag for each edge - the rankdir option is LR to make this go sideways, which seems more the norm for causal DAGs, left to right.
References
Greenland, S., Pearl, J., & Robins, J. M. (1999). Causal diagrams for
epidemiologic research. Epidemiology (Cambridge, Mass.), 10(1),
37–48. doi:10.1097/00001648-199901000-00008

Reid, C. E., Snowden, J. M., Kontgis, C., & Tager, I. B. (2012). The
role of ambient ozone in epidemiologic studies of heat-related
mortality. Environmental Health Perspectives, 120(12),
1627–30. doi:10.1289/ehp.1205251

Newell, B., & Wasson, R. (2001). Social System vs Solar System: Why
Policy Makers Need History. In: Conflict and Cooperation related to
International Water Resources : Historical Perspectives. In World
Water (Vol. 2002).
Appendix
Code:
#####################################################################
# The following output is automatically created by newnode()
# NOTE for some reason, to show on the blog, I had to replace all { braces with normal (
#####################################################################
digraph transformations (

"Metritis" -> "Fertility effects"
"Cistic Ovarian Disease" -> "Fertility effects"
"Age" -> "Fertility effects"
"Fertility effects"  [ shape=record, label="(( ( Name | Description ) | ( Fertility effects |  ) ))"]
"Fertility effects" -> "Fertility"


"Metritis" -> "Cistic Ovarian effects"
"Retained Placenta" -> "Cistic Ovarian effects"
"Age" -> "Cistic Ovarian effects"
"Cistic Ovarian effects"  [ shape=record, label="(( ( Name | Description ) | ( Cistic Ovarian effects |  ) ))"]
"Cistic Ovarian effects" -> "Cistic Ovarian Disease"


"Retained Placenta" -> "Metritis effects"
"Metritis effects"  [ shape=record, label="(( ( Name | Description ) | ( Metritis effects |  ) ))"]
"Metritis effects" -> "Metritis"


 "Age" -> "Retained Placenta effects"
"Retained Placenta effects"  [ shape=record, label="(( ( Name | Description ) | ( Retained Placenta effects |  ) ))"]
"Retained Placenta effects" -> "Retained Placenta"


 )


