"you need to use ncdf4  - not ncdf  ...
because they are netcdf4 files and not netcdf3 files.
This is poorly explained in the R community.
All of the netcdf files from Australian providers (AusCover, BoM, etc...)
have been in netcdf4 for a couple of years now."
# sudo apt-get install r-cran-ncdf4
library(ncdf4)
library(raster)
strt <-'2012-01-01'
end <- '2012-01-04'
dates <- seq(as.Date(strt),as.Date(end),1)
dates
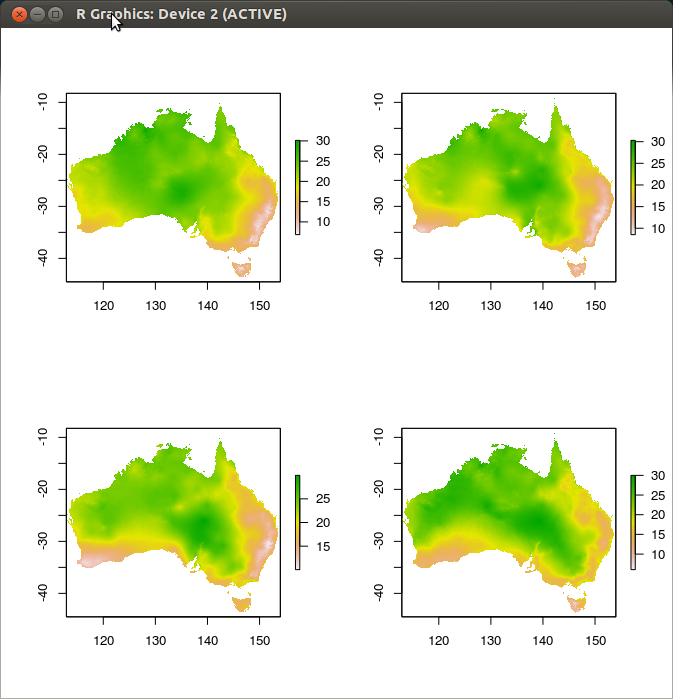
par(mfrow = c(2,2))
for(i in 1:length(dates)){
# i=1
date_i <- dates[i]
infile <- sprintf("http://dapds00.nci.org.au/thredds/dodsC/rr9/Climate/eMAST/ANUClimate/0_01deg/v1m0_aus/day/land/tmin/e_01/2012/eMAST_ANUClimate_day_tmin_v1m0_%s.nc", gsub("-", "", date_i))
nc <- nc_open(infile)
str(nc)
print(nc)
vals <- ncvar_get(nc, varid="air_temperature")
str(vals)
nc.att <- nc$var$air_temperature
xmin <- min(nc.att$dim[[1]]$vals)
xmax <- max(nc.att$dim[[1]]$vals)
ymin <- min(nc.att$dim[[2]]$vals)
ymax <- max(nc.att$dim[[2]]$vals)
print(c(xmin,xmax))
print(c(ymin,ymax))
r <- raster(t(vals),
xmn=xmin, xmx=xmax,
ymn=ymin, ymx=ymax)
#str(r)
plot(r)
nc_close(nc)
}
[...]
[1] "        licence_copyright: Copyright 2009-2013 ANU. Rights owned by The Australian National University (ANU). Rights licensed subject to TERN  Attribution (TERN-BY)."
[1] "        short_desc: Australian coverage, ANUClimate 1.0, 0.01 degree grid, 1970-2012"
[1] "        summary: Minimum daily temperature, for the Australian continent between 1970-2012. Daily temperature regulates rates of plant growth and determines critical conditions such as frost on flowering and fruiting. Modelled by expressing each daily value as a difference anomaly with respect to the gridded 1976-2005 mean daily minimum temperature for each month as provided by eMAST_ANUClimate_mmn_tmin_v1m0_1976_2005. The daily anomalies were interpolated by trivariate thin plate smoothing spline functions of longitude, latitude and vertically exaggerated elevation using ANUSPLIN Version 4.5. There was an average of 671 Bureau of Meteorology data points available for each day between 1970 and 2012. Automated quality assessment rejected on average 3 data values per day with extreme studentised residuals. These were commonly associated with days following missing observations. The root mean square of all individual cross validation residuals provided by the spline analysis is 1.5 degrees Celsius. A comprehensive assessment of the analysis and the factors contributing to the quality of the final interpolated daily minimum temperature grids is in preparation."
[1] "        long_name: Daily minimum temperature"
[1] "        contact: Michael Hutchinson, Professor of spatial and temporal analysis, 3.23A, Fenner School of Environment & Society, College of Medicine, Biology & Environment, Frank Fenner Building 141, Australian National University, Canberra, Australian Capital Territory, 200, Australia, (+61) 2 6125 4783, Michael.Hutchinson@anu.edu.au, http://orcid.org/0000-0001-8205-6689"
[1] "        references: 1. Hutchinson, M.F., Mckenney, D.W., Lawrence, K., Pedlar, J., Hopkinson, R., Milewska, E. and Papadopol, P. 2009. Development and testing of Canada-wide interpolated spatial models of daily minimum/maximum temperature and precipitation for 1961-2003. Journal of Applied Meteorology and Climatology 48: 725�741. http://dx.doi.org/10.1175/2008JAMC1979.1 2. Hutchinson, M.F. and Xu, T. 2013. ANUSPLIN version 4.4 User Guide. Fenner School of Environment and Society, Australian National University, Canberra http://fennerschool.anu.edu.au/files/anusplin44.pdf"
[1] "        source: ANUClimate 1.0"
[1] "        keywords: EARTH SCIENCE > ATMOSPHERE > ATMOSPHERIC TEMPERATURE > MAXIMUM/MINIMUM TEMPERATURE"
[1] "        Conventions: CF-1.6"
[1] "        institution: Australian National University"
[1] "        geospatial_lat_min: -43.74"
[1] "        geospatial_lat_max: -9"
[1] "        geospatial_lat_units: degrees_north"
[1] "        geospatial_lat_resolution: -0.01"
[1] "        geospatial_lon_min: 112.9"
[1] "        geospatial_lon_max: 154"
[1] "        geospatial_lon_units: degrees_east"
[1] "        geospatial_lon_resolution: 0.01"
[1] "        keywords_vocabulary: Global Change Master Directory (http://gcmd.nasa.gov)"
[1] "        metadata_link: http://datamgt.nci.org.au:8080/geonetwork"
[1] "        standard_name_vocabulary: Climate and Forecast(CF) convention standard names (http://cf-pcmdi.llnl.gov/documents/cf-standard-names)"
[1] "        id: eMAST_ANUClimate_day_tmin_v1m0_1970_2012"
[1] "        DOI: To be added"
[1] "        cdm_data_type: grid"
[1] "        contributor_name: Michael Hutchinson, Jennnifer Kesteven, Tingbao Xu"
[1] "        contributor_role: principalInvestigator, author, author"
[1] "        creator_email: eMAST.data@mq.edu.au"
[1] "        creator_name: eMAST data manager"
[1] "        creator_url: http://www.emast.org.au/"
[1] "        Metadata_Conventions: Unidata Dataset Discovery v1.0"
[1] "        publisher_name: Ecosystem Modelling and Scaling Infrastructure (eMAST) Facility: Macquarie University"
[1] "        publisher_email: eMAST.data@mq.edu.au"
[1] "        publisher_url: http://www.emast.org.au/"
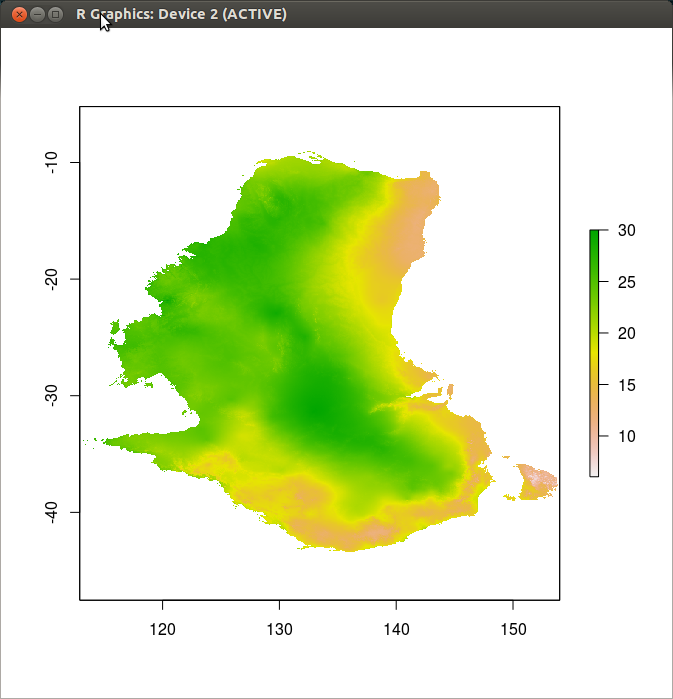
# NB weird hacky transpose still required or else you get this
r <- raster(vals,
            xmn=xmin, xmx=xmax,
            ymn=ymin, ymx=ymax)

#str(r)
plot(r)