In my last post on AEKOS Dta Portal I reported my test of the Australian Terrestrial Ecosystem Research Network (TERN) AEKOS Data Portal system implemented by Uni Adelaide’s Eco-informatics Facility.
I’ve reflected a bit on this process and I want to jot down some notes
Database restore scripts are complicated and inhibit access
I’d re-iterate my conclusion that I really like how this model emphasises the use of databases for data management (and postgres or mysql are great options)
but for a less-technically savvy person or for a casual browser just looking for some quick data to play with this is not easy enough
I spoke with Squid and Matt the developers and they described the new enhancement they are working on now to provide a simple flat file download so that will be great.
Linking Exploratory Data Analyses back to metadata and source data documentation
but this time I just wanted to get some data out and so went full steam ahead like a bull at a gate
Once I had my map visualisation done I decided to go back to the documentation to read up a bit more on why these locations were studied and other contextual metadata
But when I look in the zip I downloaded I investigated the citation.pdf and the tabledefinitions.pdf but these don’t really have much in it for me to link back to the source of the data and the documentation I need
See the citation link h ref=”http://www.portal.aekos.org.au/” target=”_blank”
so hunting around the portal again I search for the survey name “Department of Environment, Water and Natural Resources, South Australia - Dalhousie Survey (Scientific Expedition Group)
Survey”
and got 10 hits, chose number 1
skim-read of overview and scope. seems the link out from the overview/abstract is the most useful to get an overview
moved on to methods and I really like the way the segments collapse and expand as you read them, but didn’t like how I had to keep navigating back and forward with the browser (like between Study Location Selection Method and Study Location Visit Method, each time I went back I had to scroll to bottom of page to get to list of sections)
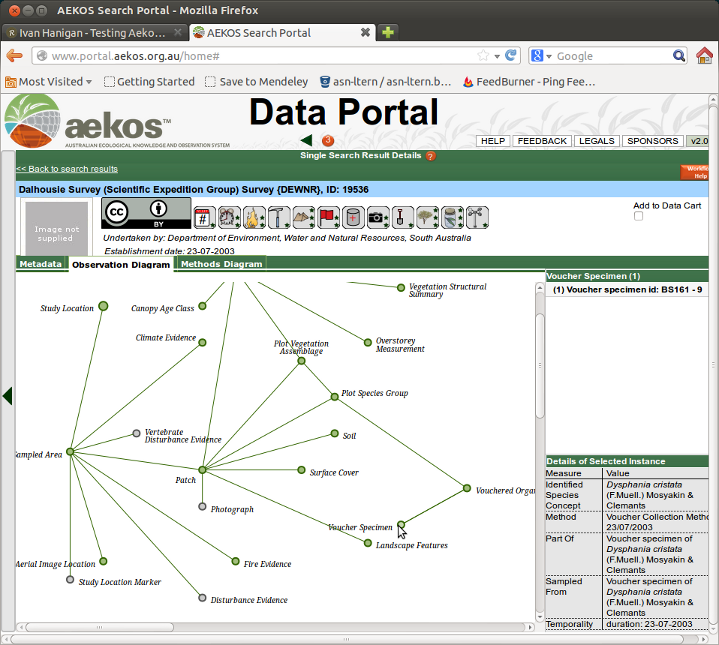
Finally I got to explore the observation diagram and methods diagram which I have not seen before. These seem like a great way to show the information and let people browse through the concepts etc…
But I think I still prefer an old school document with a table of contents and some kind of index.