probably the easiest way to do this is to use
Hadley's devtools package.  Assuming you have devtools and my package's
dependencies.  If you're using Linux or the BSD's, this should just
work.  Welcome to the good life, player.  I think this will work out
of the box on a Mac.  I have no idea if this will work on Windows; how
you strange people get anything done amazes me.  At the least,
Im guessing you have to install Rtools first.
You could also just source all the R scripts like
some kind of barbarian
# depends
require(swishdbtools)
if(!require(raster)) install.packages("raster", dependencies = T); require(raster)
if(!require(rgdal)) install.packages("rgdal", dependencies = T); require(rgdal)
# on linux can install direct, on windoze you configure Rtools
require(devtools)
install_github("awaptools", "swish-climate-impact-assessment")
require(awaptools)
homedir <- "~/data/AWAP_GRIDS/data"
outdir <- "~/data/AWAP_GRIDS/data-seasonal-vignette"
# first make sure there are no left over files from previous runs
#oldfiles <- list.files(pattern = '.tif', full.names=T)
#for(oldfile in oldfiles)
#{
# print(oldfile)
# file.remove(oldfile)
#}
################################################
setwd(homedir)
# local customisations
workdir <- homedir
setwd(workdir)
# don't change this
years <- c(1900:2014)
lengthYears <- length(years)
# change this
startdate <- "2013-01-01"
enddate <- "2014-01-31"
# do
load_monthly(start_date = startdate, end_date = enddate)
# do
filelist <- dir(pattern = "grid.Z$")
for(fname in filelist)
{
#fname <- filelist[1]
unzip_monthly(fname, aggregation_factor = 1)
fin <- gsub(".grid.Z", ".grid", fname)
fout <- gsub(".grid.Z", ".tif", fname)
r <- raster(fin)
writeRaster(r, fout, format="GTiff", overwrite = TRUE)
file.remove(fin)
}
cfiles <- list.files(pattern = '.tif', full.names=T)
# loop thru
# NEED TO SET THE FILESOFSEASEON_I counter EACH TIME YOU start
for(season in c("hot", "cool"))
{
# season <- "hot" # for labelling
if(season == "cool")
{
filesOfSeason_i <- c(5,6,7,8,9,10)
endat <- lengthYears
} else {
filesOfSeason_i <- c(11,12,13,14,15,16)
endat <- lengthYears - 1
}
for (year in 1:endat){
## setup for checking month
# year <- 1 #endat
## checking
print(cat("####################\n\n"))
print(cfiles[filesOfSeason_i])
b <- brick(stack(cfiles[filesOfSeason_i]))
## calculate mean
m <- mean(b)
## checking
# image(m)
writeRaster(m, file.path(outdir,sprintf("season_%s_%s.tif", season, year)), drivername="GTiff")
filesOfSeason_i <- filesOfSeason_i + 12
}
}
##### now we will overall average
setwd(outdir)
for(season in c("cool", "hot"))
{
cfiles <- list.files(pattern = season, full.names=T)
print(cfiles)
b <- brick(stack(cfiles))
## calculate mean
m <- mean(b)
## checking
# image(m)
writeRaster(m, file.path(outdir,sprintf("season_%s.tif", season)), drivername="GTiff")
}
# qc
cool <- raster("season_cool.tif")
hot <- raster("season_hot.tif")
par(mfrow = c(2,1))
image(cool)
image(hot)
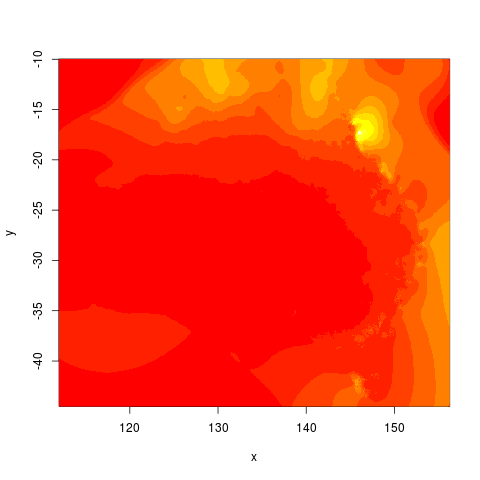
# just summer rainfall
png("season_hot.png")
image(hot)
dev.off()