
Excess Heat Indices
Table of Contents
1 auto-download-bureau-meteorology-diurnal-data
- We;re looking at health impacts of high temperatures at work
- need to see the highest temperatures during the working hours
- bom provides hourly data for download, but only 3 days at a time
- we build a script and set it on a schedule to run every day, download the data and collate the results
1.1 First the FTP server URL structure
- The URLS are predictable, just need the station id, state and a code if metro or rural
1.2 table
| StationID | State | City9orregional8_ |
| 94774 | N | 9 |
| 95719 | N | 8 |
| 94768 | N | 9 |
| 94763 | N | 9 |
| 94767 | N | 9 |
| 94910 | N | 8 |
| 94929 | N | 8 |
| 95896 | N | 8 |
| 94693 | N | 8 |
| 94691 | N | 8 |
| 95677 | S | 9 |
| 94675 | S | 9 |
| 94672 | S | 9 |
| 94866 | V | 9 |
| 95867 | V | 9 |
| 94868 | V | 9 |
| 94875 | V | 8 |
- now create a script called "bomdownload.r"
- it takes the station details and paste into the URLs
- downloads the files
- stores in a directory for each days downloads
1.3 R Code: bomdownload.r
filename = "~/data/ExcessHeatIndices/inst/doc/weather_stations.csv"
output_directory = "~/bom-downloads"
setwd(output_directory)

urls <- read.csv(filename)
urls_list <- paste(sep = "", "http://www.bom.gov.au/fwo/ID",
                  urls$State,
                  "60",
                  urls$City_9_or_regional_8_,
                  "01/ID",
                  urls$State,
                  "60",
                  urls$City_9_or_regional_8_,
                  "01.",
                  urls$Station_ID,
                  ".axf")

output_directory <- file.path(output_directory,Sys.Date())
dir.create(output_directory)

for(url in urls_list)
{
  output_file <- file.path(output_directory,basename(url))
  download.file(url, output_file, mode = "wb")

}
print("SUCCESS")
- Now the data can be combined
- clean up the header and extraneous extra line at the bottom
1.4 R Code: bomcollation.r
# this takes data in directories from bom_download.r

# first get list of directories
filelist <- dir(pattern = "axf", recursive = T)
filelist

# next get directories for days we haven't done yet
if(file.exists("complete_dataset.csv"))
{
complete_data <- read.csv("complete_dataset.csv", stringsAsFactors = F)
#str(complete_data)
last_collated <- max(as.Date(complete_data$date_downloaded))
#max(complete_data$local_hrmin)

days_downloaded <- dirname(filelist)
filelist <- filelist[which(as.Date(days_downloaded) > as.Date(last_collated))]
}

# for these collate them into the complete file
for(f in filelist)
{
  #f <- filelist[2]
  print(f)
  fin <- read.csv(f, colClasses = c("local_date_time_full.80." = "character"),
    stringsAsFactors = F, skip = 19)
  fin <- fin[1:(nrow(fin) - 1),]
  fin$date_downloaded <- dirname(f)
  fin$local_year <- substr(fin$local_date_time_full.80., 1, 4)
  fin$local_month <- substr(fin$local_date_time_full.80., 5, 6)
  fin$local_day <- substr(fin$local_date_time_full.80., 7, 8)
  fin$local_hrmin <- substr(fin$local_date_time_full.80., 9, 12)
  fin$local_date <- paste(fin$local_year, fin$local_month, fin$local_day, sep = "-")
  if(file.exists("complete_dataset.csv"))
  {
  write.table(fin, "complete_dataset.csv", row.names = F, sep = ",", append = T, col.names = F)
  } else {
  write.table(fin, "complete_dataset.csv", row.names = F, sep = ",")
  }
}
- so now let;s automate the process
- make a BAT file
1.5 BAT file (windoze)
"C:\Program Files\R\R-2.15.2\bin\Rscript.exe" "~\bom-downloads\bom_download.r"
- add this bat file to the scheduled tasks in your control panel
- use chron for a linux version
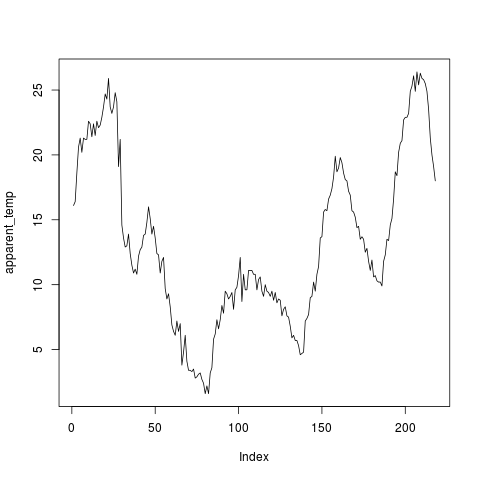
1.6 check the data
#### name:check the data ####
require(plyr)

setwd("~/bom-downloads")
source("bom_download.r")
dir()
source("bom_collation.r")

complete_data <- read.csv("complete_dataset.csv", stringsAsFactors = F)
str(complete_data)

# Quick and dirty de-duplication
table(complete_data$name.80.)
qc <- subset(complete_data, name.80. == "Broken Hill Airport")
qc <- ddply(qc, "local_date_time_full.80.",
  summarise, apparent_temp = mean(apparent_t))

names(qc)
png("qc-diurnal-plot.png")
with(qc,
     plot(apparent_temp, type= "l")
     )
dev.off()
1.7 Conclusions
- watch the data roll on in
- each day there are about 3 days downloaded
- meaning duplicates will be frequent, need to write a script to de-duplicate
- cheers!
</html>


