
Background
This is an example of using github for a Reproducible Research Report (RRR) using a casestudy of the Hutchinson Drought Index. The project is available under GNU licence at https://github.com/ivanhanigan/HutchinsonDroughtIndex.
Aims
This example will clone the repository from github and run the replication codes using the replication datasets.
Materials and Methods
- assumes you are connected to the internet
- assumes you have git, a github account and ssh key set up
- assumes you have R and GDAL configured
- assumes BoM and ABS have kept their data in the locations I specified to download from
Hutchinsons Drought Index
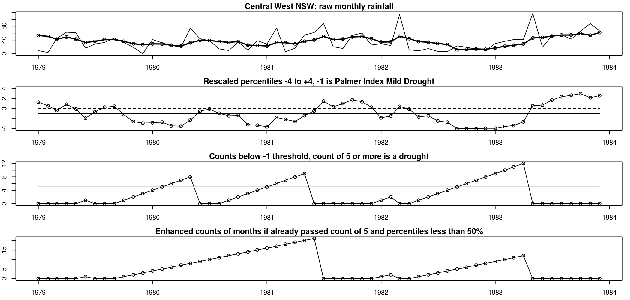
The Hutchinson Drought Index (or Drought Severity Index) is a climatic drought index that was designed to reflect agricultural droughts using only rainfall data.
The index was invented by Professor Mike Hutchinson at the ANU in 1992 (1) and this project includes R codes written to describe the calculations and also to download data (2,3) to play with.
Results
Replication Codes to run in the terminal
git clone git@github.com:ivanhanigan/HutchinsonDroughtIndex.git ~/data/HutchinsonDroughtIndex
R
setwd("~/data/HutchinsonDroughtIndex")
source("HutchinsonDroughtIndex_go.r")
- WARNING this downloads 5.4MB from BoM and 19.9MB from ABS
- This runs the codes and produces graphs
- an alternative workflow would be to run the sweave file in the reports directory but I dont like that method as much and have set all the evaluation commands to false.
- it will run now that we have the graphs though, to create a report:
Code:
setwd("reports")
Sweave("HutchinsonDroughtIndex_transformations_doc.Rnw")
- which creates a tex file that can create this pdf
- but the simplest example I gave above will compute the index and create the graphs (one is shown below)
So what actually happened?
- This project adheres to the Reichian LCFD model of writing R code
- In this the code is bundled into modules Func (tools), Load, Do, Clean (check). These live in the src directory (following teh White ProjectTemplate model - well almost, He would put tools/func into lib)
- then a main.r (or go.r) script calls these modules
go.r
 source('src/HutchinsonDroughtIndex_tools.r')
 source('src/HutchinsonDroughtIndex_load.r')
 source('src/HutchinsonDroughtIndex_do.r')
 source('src/HutchinsonDroughtIndex_check.r')
-
The really interesting bit is a tool written for this project that is called from within tools.r
source(‘src/HutchinsonDroughtIndex_tools_droughtIndex.r’)
- A keen reader would look in that script to find out exactly what the function does
- A keen author would push that function to an R package (a super keen bean would publish this on CRAN)
Discussion
Strengths:
- full codes are provided to reproduce the data access, manipulation and analysis
- the gory details are hidden from the casual user
Weaknesses:
- the important details are hidden from the technical user
- the script depends on a bunch of things that might not be true
Conclusions
- This is an example of a self-contained RRR
References
-
Smith, D. I, Hutchinson, M. F, & McArthur, R. J. (1992) Climatic and Agricultural Drought: Payments and Policy. (Centre for Resource and Environmental Studies, Australian National University, Canberra, Australia).
http://fennerschool-research.anu.edu.au/spatio-temporal/publications/cres_paper1992.pdf -
Bureau of Meteorology High Quality Monthly precipitation data downloaded on 2012-01-09 from ftp://ftp.bom.gov.au/anon/home/ncc/www/change/HQmonthlyR/HQ_monthly_prcp_txt.tar
-
Australian Bureau of Statistics Statistical Divisions 2006 downloaded on 2012-01-09 from http://www.abs.gov.au/AUSSTATS/abs@.nsf/DetailsPage/1259.0.30.0022006?OpenDocument
Acknowledgements
Financial support was provided by Professor Tony McMichael’s “Australia Fellowship” from the the National Health and Medical Research Council, via the National Centre for Epidemiology and Population Health, Australian National University.


