
I will use the NMMAPSlite datasets for a simple example of what I describe as “Spatially Structured Timeseries” as opposed to “Spatio-Temporal” which I think more explicitly includes spatial structure in the model. See This Report for all the gory details.
R Codes
Spatiotemporal Regression Modelling
Table of Contents
1 Core Model
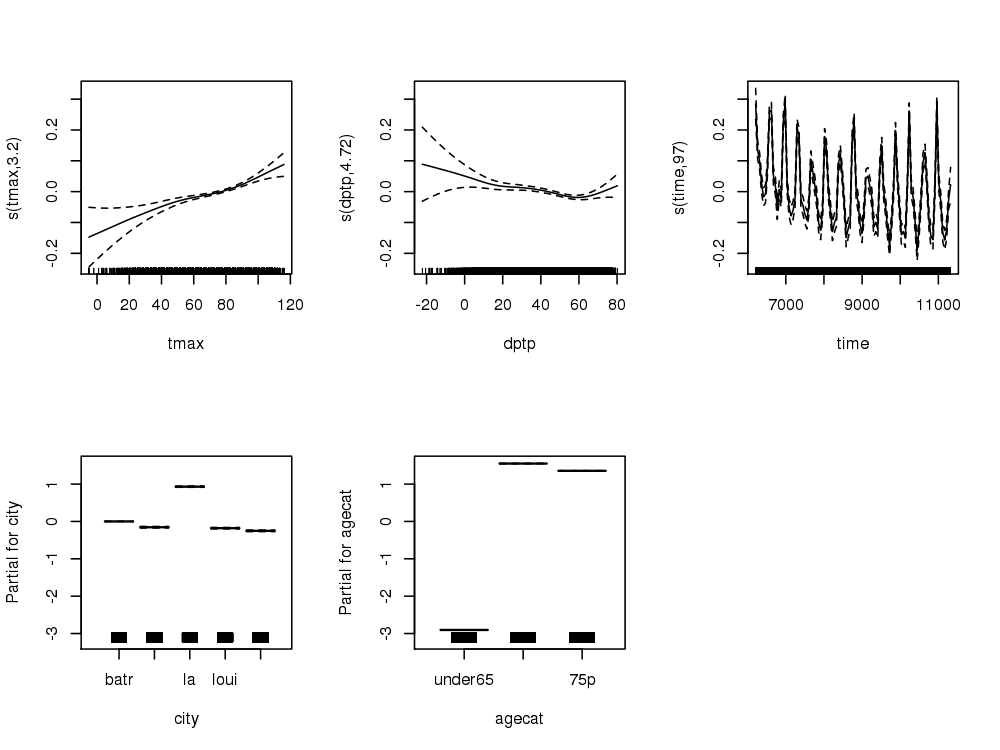
################################################################
# name:core
# func
setwd("~/projects/spatiotemporal-regression-models/NMMAPS-example")
require(mgcv)
require(splines)

# load
analyte <- read.csv("analyte.csv")

# clean
analyte$yy <- substr(analyte$date,1,4)
numYears<-length(names(table(analyte$yy)))
analyte$date <- as.Date(analyte$date)
analyte$time <- as.numeric(analyte$date)
analyte$agecat <- factor(analyte$agecat,
                          levels = c("under65",
                              "65to74", "75p"),
                          ordered = TRUE
                          )

# do
fit <- gam(cvd ~ s(tmax) + s(dptp) +
           city + agecat +
           s(time, k= 7*numYears, fx=T) +
           offset(log(pop)),
           data = analyte, family = poisson
           )

# plot of response functions
png("images/nmmaps-eg-core.png", width = 1000, height = 750, res = 150)
par(mfrow=c(2,3))
plot(fit, all.terms = TRUE)
dev.off()
2 Core Model Plots
</html>


