
adjacency example
Table of Contents
1 Introduction
I've got a timeseries model I am fitting to a city dataset with about 45 zones. The data are daily, stratified by Zone, Age and Sex. Following on from learning about spatiallly correlated errors I want to see if the Standard Error on the estimated \(\beta_{1}\) from the timeseries model is affected.
I think the simplest option is to use the spatial lag model, which can be fitted with just adding a term that is the average of the set of each Zone's neighbours outcome level on each day. For this I need to find the list of each region's neighbours. Then I'll use this to assign each zone/day/age group their neighbours values and then collapse that to get their daily means.
2 Load some test data
# we have access to a classic dataset for studying spatial dependence
# in the spdep package
if(!require(spdep))    install.packages(spdep); require(spdep)
if(!require(rgdal))    install.packages(rgdal); require(rgdal)
if(!require(maptools)) install.packages(maptools); require(maptools)
if(!require(maps))     install.packages(maps); require(maps)
fn <- system.file("etc/shapes/eire.shp", package="spdep")[1]
prj <- CRS("+proj=utm +zone=30 +units=km")
eire <- readShapeSpatial(fn, ID="names", proj4string=prj)
str(eire)
# reproject into a better coordinate system
eire <- spTransform(eire, CRS("+proj=longlat +datum=WGS84"))
# check out the attributes
head(eire@data)
| A | towns | pale | size | ROADACC | OWNCONS | POPCHG | RETSALE | INCOME | names |
|---|---|---|---|---|---|---|---|---|---|
| 34.2 | 0.12 | 1 | 1087 | 3664 | 8.6 | 97 | 2962 | 7185 | Carlow |
| 29.68 | 0.01 | 0 | 2133 | 5000 | 15 | 69 | 4452 | 9459 | Cavan |
| 26.54 | 0.01 | 0 | 535 | 4321 | 19 | 78 | 3460 | 12435 | Clare |
| 23.92 | 0.03 | 0 | 1476 | 4118 | 9 | 90 | 28402 | 65901 | Cork |
| 27.91 | 0.03 | 0 | 989 | 7500 | 27 | 75 | 7478 | 17626 | Donegal |
| 32.79 | 0.61 | 1 | 18105 | 3078 | 9.4 | 142 | 89424 | 164631 | Dublin |
3 spdep calculates neighbours
nb <- poly2nb(eire)
str(nb)
#List of 26
nb[[1]]
#[1]  9 10 11 25 26
# So this returns the set of index values for each area's neighbours
# I'd prefer to read their names
eire[['names']][1]
# > [1] Carlow
# so therefore the neighbours of area 1 "Carlow" are in the first
# element of the list
eire[['names']][nb[[1]]]
# > [1] Kildare  Kilkenny Laoghis  Wexford  Wicklow
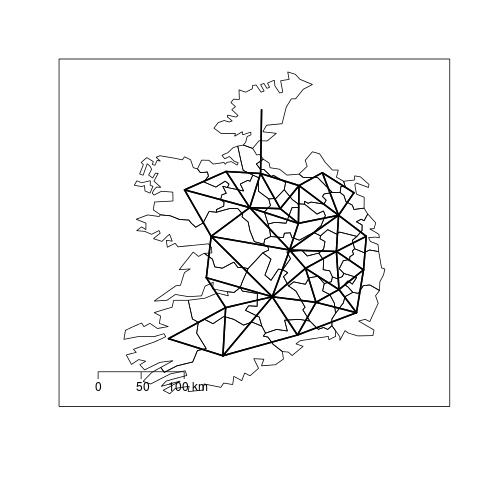
4 plot these
################################################################
# name:plot these
png("images/Fig1.png")
plot(eire)
plot(nb, coordinates(eire), add=TRUE, pch=".", lwd=2)
map.scale(ratio = F)
box()
dev.off()
5 function to return adjacency list as a dataframe
I THINK I actually want this as a dataframe so I can merge it with the master table of outcome data.
################################################################
# name:adjacency_df
adjacency_df <- function(NB, shp, zone_id)
  {
    adjacencydf <- as.data.frame(matrix(NA, nrow = 0, ncol = 2))
    for(i in 1:length(NB))
    {
      if(length(shp[[zone_id]][NB[[i]]]) == 0) next
      adjacencydf <- rbind(
                           adjacencydf,
                           cbind(
                                 as.character(shp[[zone_id]][i]),
                                 as.character(shp[[zone_id]][NB[[i]]])
                                 )
                           )
    }
    return(adjacencydf)
  }
6 test-adjacency df
################################################################
# name:adjacency_df
adj <- adjacency_df(NB = nb, shp = eire, zone_id = 'names')
adj
| Carlow | Kildare |
| Carlow | Kilkenny |
| Carlow | Laoghis |
| Carlow | Wexford |
| Carlow | Wicklow |
| Cavan | Leitrim |
| Cavan | Longford |
| Cavan | Meath |
| Cavan | Monaghan |
| Cavan | Westmeath |
| Clare | Galway |
| Clare | Limerick |
| Clare | Tipperary |
| Cork | Kerry |
| Cork | Limerick |
| Cork | Tipperary |
| Cork | Waterford |
| Donegal | Leitrim |
| Dublin | Kildare |
| Dublin | Meath |
| Dublin | Wicklow |
| Galway | Clare |
| Galway | Mayo |
| Galway | Offaly |
| Galway | Roscommon |
| Galway | Tipperary |
| Kerry | Cork |
| Kerry | Limerick |
| Kildare | Carlow |
| Kildare | Dublin |
| Kildare | Laoghis |
| Kildare | Meath |
| Kildare | Offaly |
| Kildare | Wicklow |
| Kilkenny | Carlow |
| Kilkenny | Laoghis |
| Kilkenny | Tipperary |
| Kilkenny | Waterford |
| Kilkenny | Wexford |
| Laoghis | Carlow |
| Laoghis | Kildare |
| Laoghis | Kilkenny |
| Laoghis | Offaly |
| Laoghis | Tipperary |
| Leitrim | Cavan |
| Leitrim | Donegal |
| Leitrim | Longford |
| Leitrim | Roscommon |
| Leitrim | Sligo |
| Limerick | Clare |
| Limerick | Cork |
| Limerick | Kerry |
| Limerick | Tipperary |
| Longford | Cavan |
| Longford | Leitrim |
| Longford | Roscommon |
| Longford | Westmeath |
| Louth | Meath |
| Louth | Monaghan |
| Mayo | Galway |
| Mayo | Roscommon |
| Mayo | Sligo |
| Meath | Cavan |
| Meath | Dublin |
| Meath | Kildare |
| Meath | Louth |
| Meath | Monaghan |
| Meath | Offaly |
| Meath | Westmeath |
| Monaghan | Cavan |
| Monaghan | Louth |
| Monaghan | Meath |
| Offaly | Galway |
| Offaly | Kildare |
| Offaly | Laoghis |
| Offaly | Meath |
| Offaly | Roscommon |
| Offaly | Tipperary |
| Offaly | Westmeath |
| Roscommon | Galway |
| Roscommon | Leitrim |
| Roscommon | Longford |
| Roscommon | Mayo |
| Roscommon | Offaly |
| Roscommon | Sligo |
| Roscommon | Westmeath |
| Sligo | Leitrim |
| Sligo | Mayo |
| Sligo | Roscommon |
| Tipperary | Clare |
| Tipperary | Cork |
| Tipperary | Galway |
| Tipperary | Kilkenny |
| Tipperary | Laoghis |
| Tipperary | Limerick |
| Tipperary | Offaly |
| Tipperary | Waterford |
| Waterford | Cork |
| Waterford | Kilkenny |
| Waterford | Tipperary |
| Waterford | Wexford |
| Westmeath | Cavan |
| Westmeath | Longford |
| Westmeath | Meath |
| Westmeath | Offaly |
| Westmeath | Roscommon |
| Wexford | Carlow |
| Wexford | Kilkenny |
| Wexford | Waterford |
| Wexford | Wicklow |
| Wicklow | Carlow |
| Wicklow | Dublin |
| Wicklow | Kildare |
| Wicklow | Wexford |
</html>


