Droughts are extreme rainfall events on centennial scale
In the Hutchinson Drought Index project we used the longest period of rainfall data available because the drought index is based on the ranking of each six-month average of the distribution in the entire record of observations. A period as long as this is required to calculate extreme rainfall deficits. The original Hutchinson paper used a period 1920-1988 due to availability. Another consideration is the longer term characteristics of the rainfall epoch you are considering.
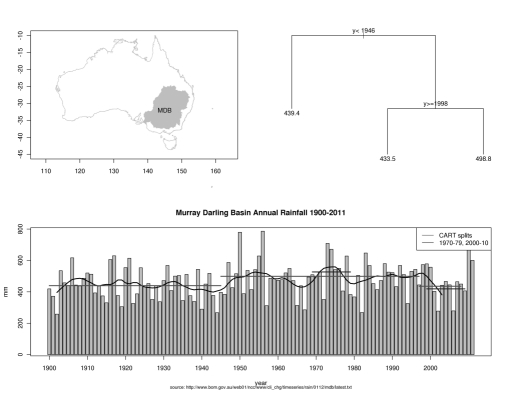
For example, in recent decades in Southeastern Australia annual total rainfal does not represent the longer term context very well. Shown in the image below is the result of an exploratory data analysis using rainfall data from the Murray Darling Basin (the ‘bread basket’ of Australian agriculture). I use the Classification And Regression Tree tool in the ‘rpart’ package to determine the optimal groupings. I’ve dropped the last two years of the sequence because when I first ran this analysis two years ago I got the result shown, but thankfully the last two years have given us very good rainfalls. This shows the difference between short-term and long-term rainfall patterns.
Regardless of this data ‘massaging’, in the analysis presented the annual trend over the first half of the twentieth century was lower than the recent fifty years, by about 60 millimeters on average. The 1930-1946 period was particularly dry, as has been the 1998-2008 period.